The Data Space
Jon Reades - j.reades@ucl.ac.uk
1st October 2025
Where does data come from?
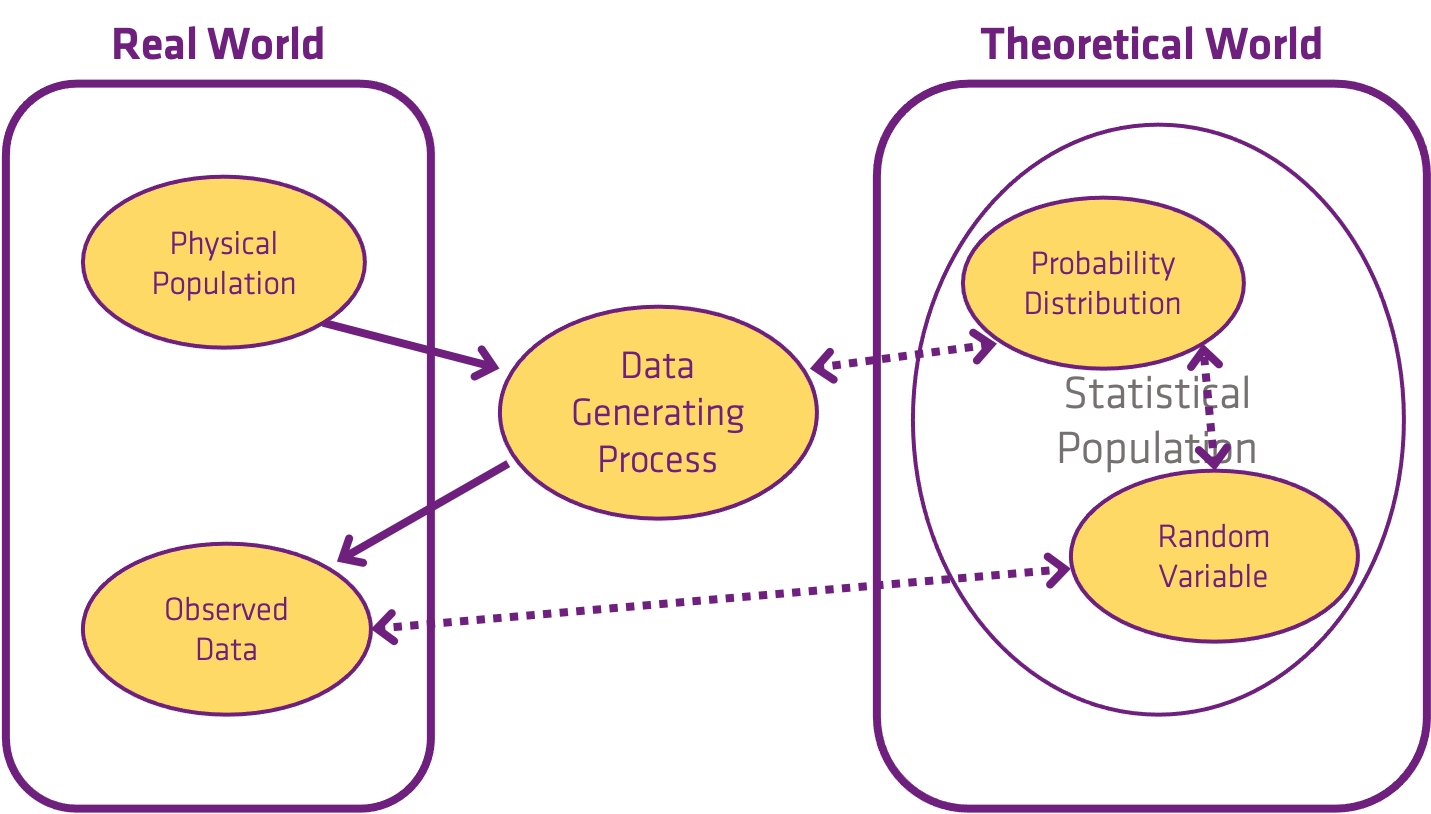
The Data Generating Process
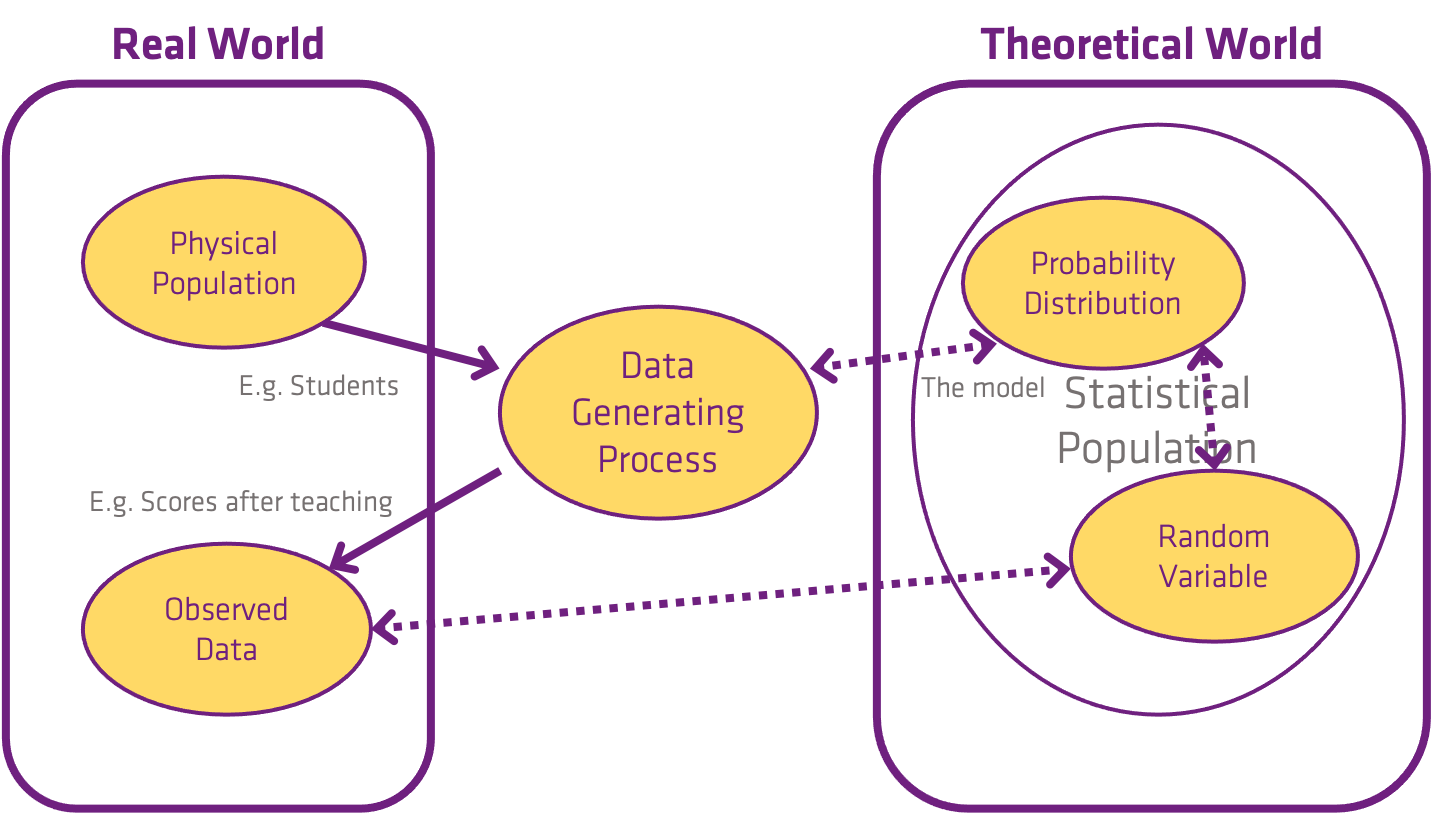
The Data Generating Process
Cashier Income as DGP
Question: Retail cashier annual salaries have a Normal distribution with a mean equal to $25,000 and a standard deviation equal to $2,000. What is the probability that a randomly selected retail cashier earns more than $27,000?
Answer: 15.87%
Result: All models are wrong, but some are useful (George Box)
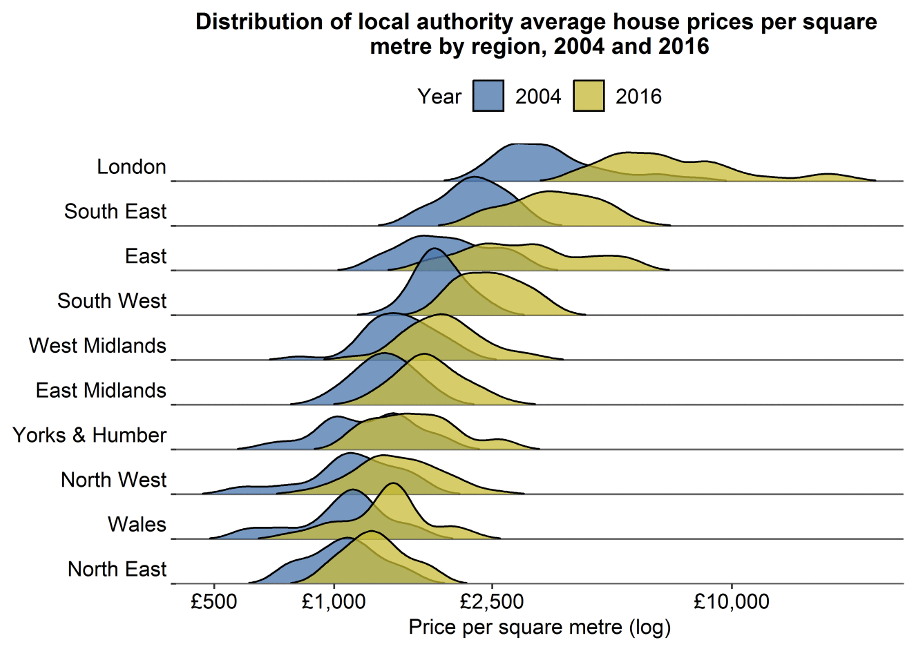
House Prices as DGP
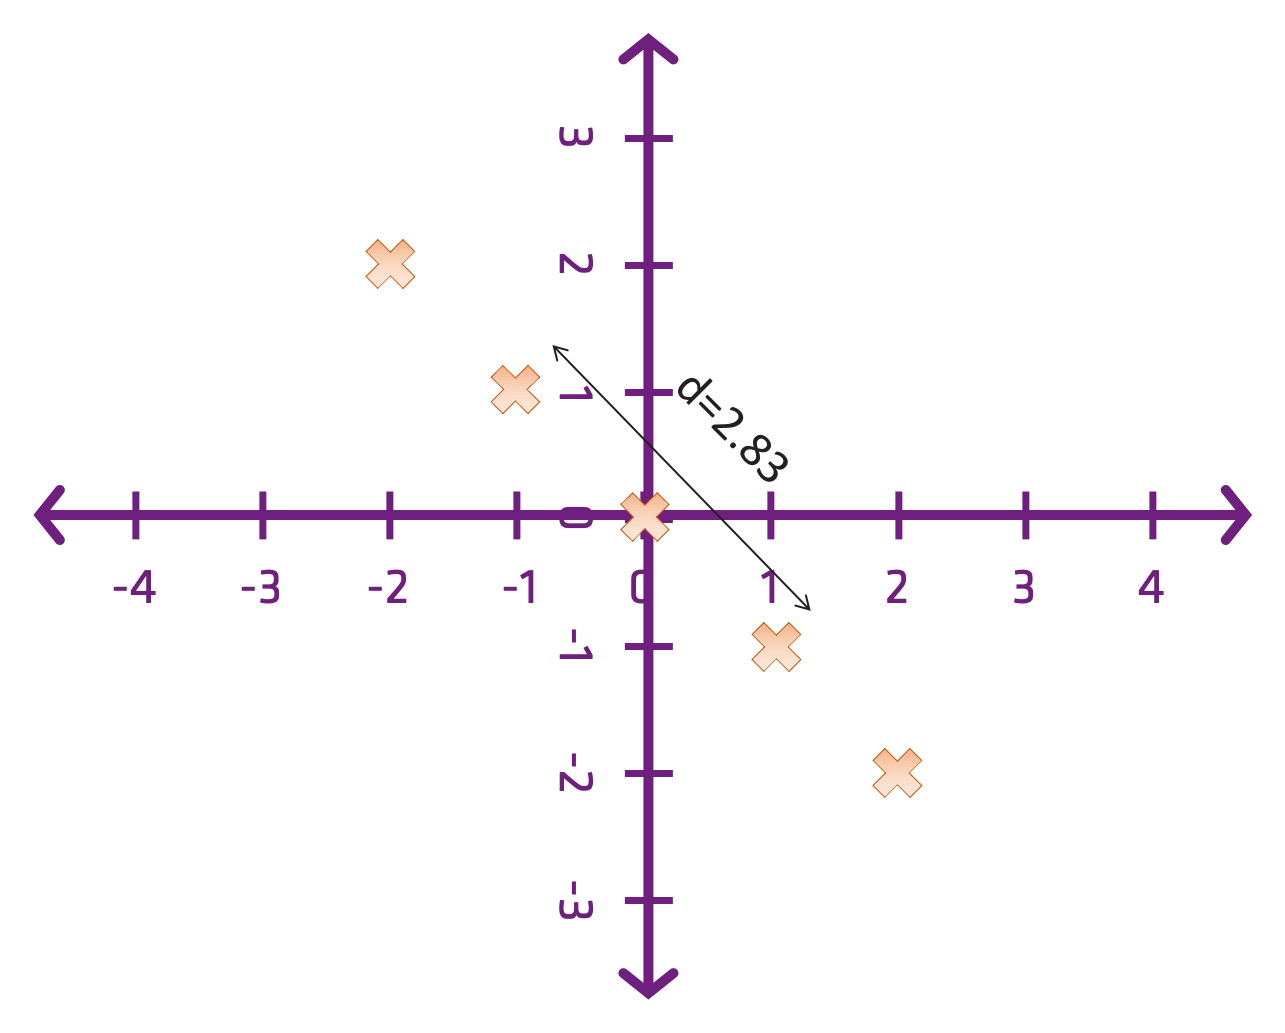
Distance…
Is Bill Gates as Rich as He is Tall?
Instinctively, we know that Bill Gates’ wealth is much further from ‘normal’ than is his height. But how?
- How can we compare income and height if they share no common units?
- How can we compare the biodiversity of sites in the tropics with those of sub-Arctic areas given that there are different numbers of species to begin with?
We need:
- Ways to make different dimensions comparable, and
- Ways to remove unit effects from distance measures.
Distance in 1D
\[ d(i,j) = |(i_{1}-j_{1})| \]
Distance in 2D
\[ d(i,j) = \sqrt{(i_{1}-j_{1})^{2}+(i_{2}-j_{2})^{2}} \]
Distance in 3D… or More
We can keep adding dimensions…
\[ d(i,j) = \sqrt{(i_{1}-j_{1})^{2}+(i_{2}-j_{2})^{2}+(i_{3}-j_{3})^{2}} \]
You continue adding dimensions indefinitely, but from here on out you are dealing with hyperspaces!
Thinking in Data Space
We can write the coordinates of an observation with 3 attributes (e.g. height, weight, income) as:
\[ x_{i} = { {x_{i1}, x_{i2}, x_{i3} } } \]
Something with 8 attributes (e.g. height, weight, income, age, year of birth, …) ‘occupies’ an 8-dimensional space…
Two Propositions
- That geographical space is no different from any other dimension in a data set.
- That geographical space is still special when it comes to thinking about relationships.
Implication
If you can shift from thinking in columns of data, to thinking of a data space then you’ll have a much easier time dealing with dimensionality reduction and clustering.
Additional Resources
- Are Statisticians Cold-Blooded Bosses?
- Beyond 3D: Thinking in Higher Dimensions
- Visualizing beyond 3 Dimensions
- The things you’ll find in higher dimensions (also useful for dimensionality reduction)
- What’s a Tensor? (heavy on the Physics relevance, but a lot of useful terminology and abstraction)
