Grouping Data
Useful, But Limited?
| Method | Achieves |
|---|---|
count() |
Total number of items |
first(), last() |
First and last item |
mean(), median() |
Mean and median |
min(), max() |
Minimum and maximum |
std(), var() |
Standard deviation and variance |
mad() |
Mean absolute deviation |
prod() |
Product of all items |
sum() |
Sum of all items |
Grouping Operations
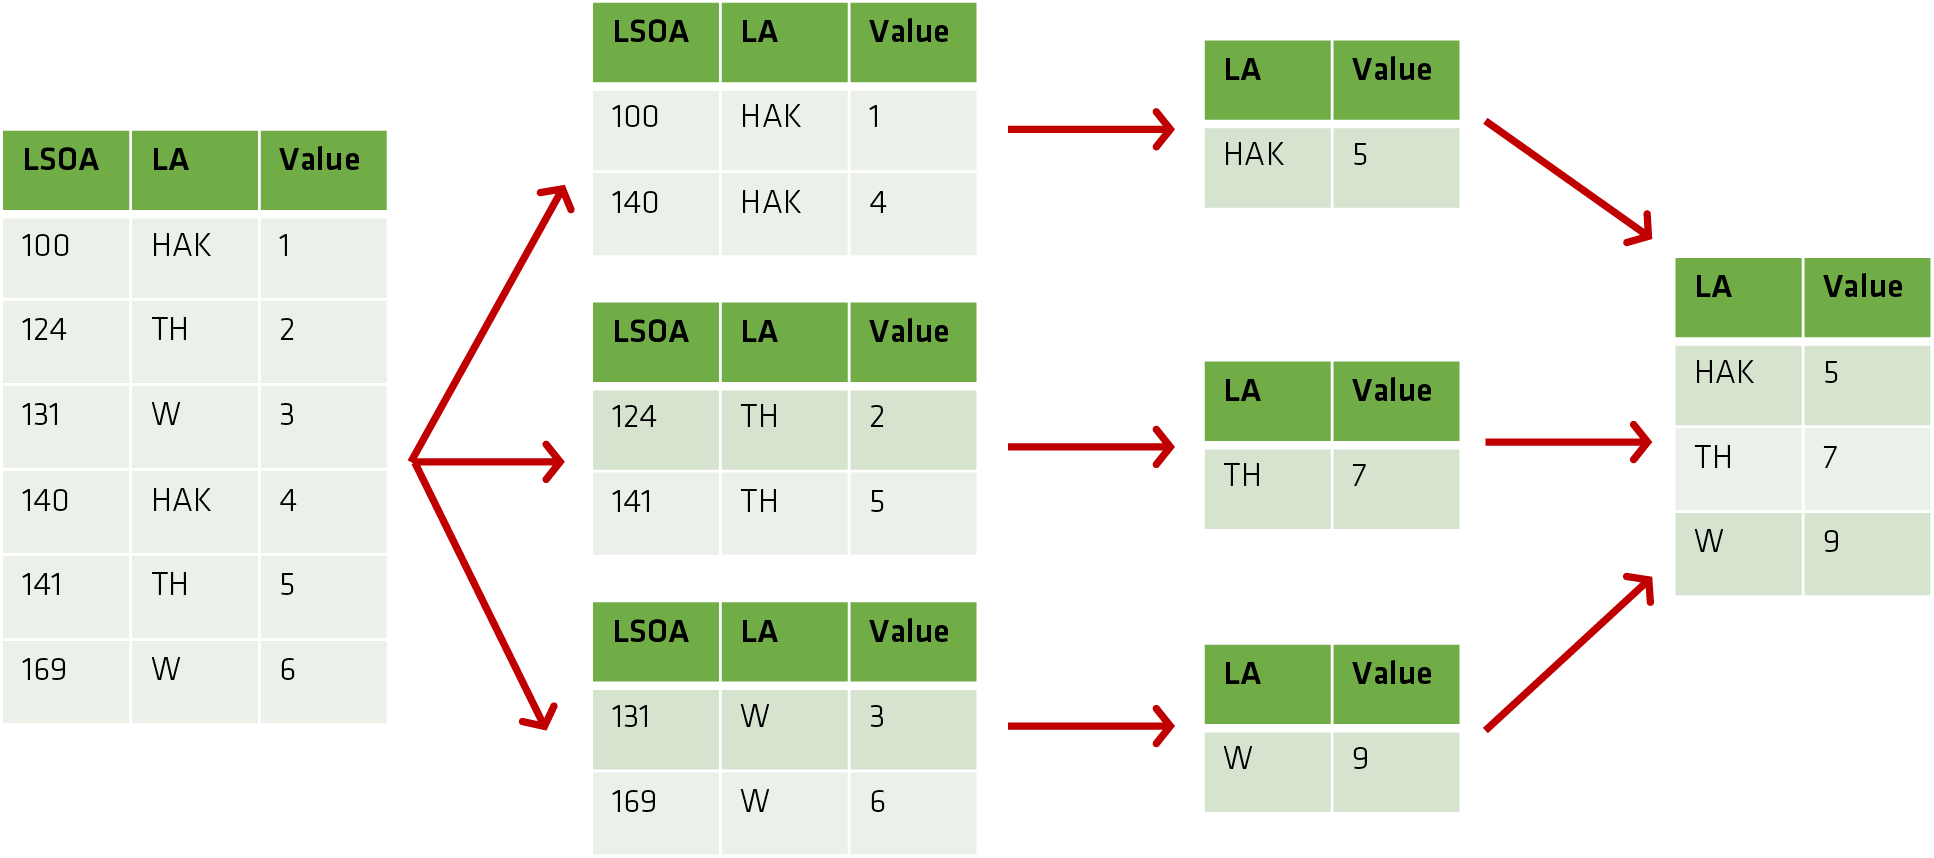
In Pandas these follow a split / apply / combine approach:

In Practice
For instance, if we had a Local Authority (LA) field:
Using apply the function could be anything:
Grouping by Arbitrary Mappings
mapping = {'HAK':'Inner', 'TH':'Outer', 'W':'Inner'}
df.set_index('LA', inplace=True)
df.groupby(mapping).sum()
Pivot Tables
A ‘special case’ of Group By features:
- Commonly-used in business to summarise data for reporting.
- Grouping (summarisation) happens along both axes (Group By operates only on one).
pandas.cut(<series>, <bins>)can be a useful feature here since it chops a continuous feature into bins suitable for grouping.
In Practice

Deriving Measures of Diversity
One of the benefits of grouping is that it enables us to derive measures of density and diversity; here are just a few… Location Quotient (LQ), Herfindah-Hirschman Index (HHI), Shanon Entropy.
Location Quotient
The LQ for industry i in zone z is the share of employment for i in z divided by the share of employment of i in the entire region R. \[ LQ_{zi} = \dfrac{Emp_{zi}/Emp_{z}}{Emp_{Ri}/Emp_{R}} \]
| High Local Share | Low Local Share | |
|---|---|---|
| High Regional Share | \[\approx 1\] | \[< 1\] |
| Low Regional Share | \[> 1\] | \[\approx 1\] |
Herfindahl-Hirschman index
The HHI for an industry i is the sum of squared market shares for each company in that industry: \[ H = \sum_{i=1}^{N} s_{i}^{2} \]
| Concentration Level | HHI |
|---|---|
| Monopolistic: one firm accounts for 100% of the market | \[1.0\] |
| Oligopolistic: top five firms account for 60% of the market | \[\approx 0.8\] |
| Competitive: anything else? | \[< 0.5\]? |
Shannon Entropy
Shannon Entropy is an information-theoretic measure: \[ H(X) = - \sum_{i=1}^{n} P(x_{i}) log P(x_{i}) \]
Resources

Grouping Data • Jon Reades