Clustering
Jon Reades - j.reades@ucl.ac.uk
1st October 2026
Spot the Difference
Classification
- Allocates n samples to k groups
- Works for different values of k
- Different algorithms (A) present different views of group relationships
- Poor choices of A and k lead to weak understanding of data
- Typically works best in 1–2 dimensions
Clustering
- Allocates n samples to k groups
- Works for different values of k
- Different algorithms A present different views of group relationships
- Poor choices of A and k lead to weak understanding of data
- Typically works best in < 9 dimensions
The First Geodemographic Classification?
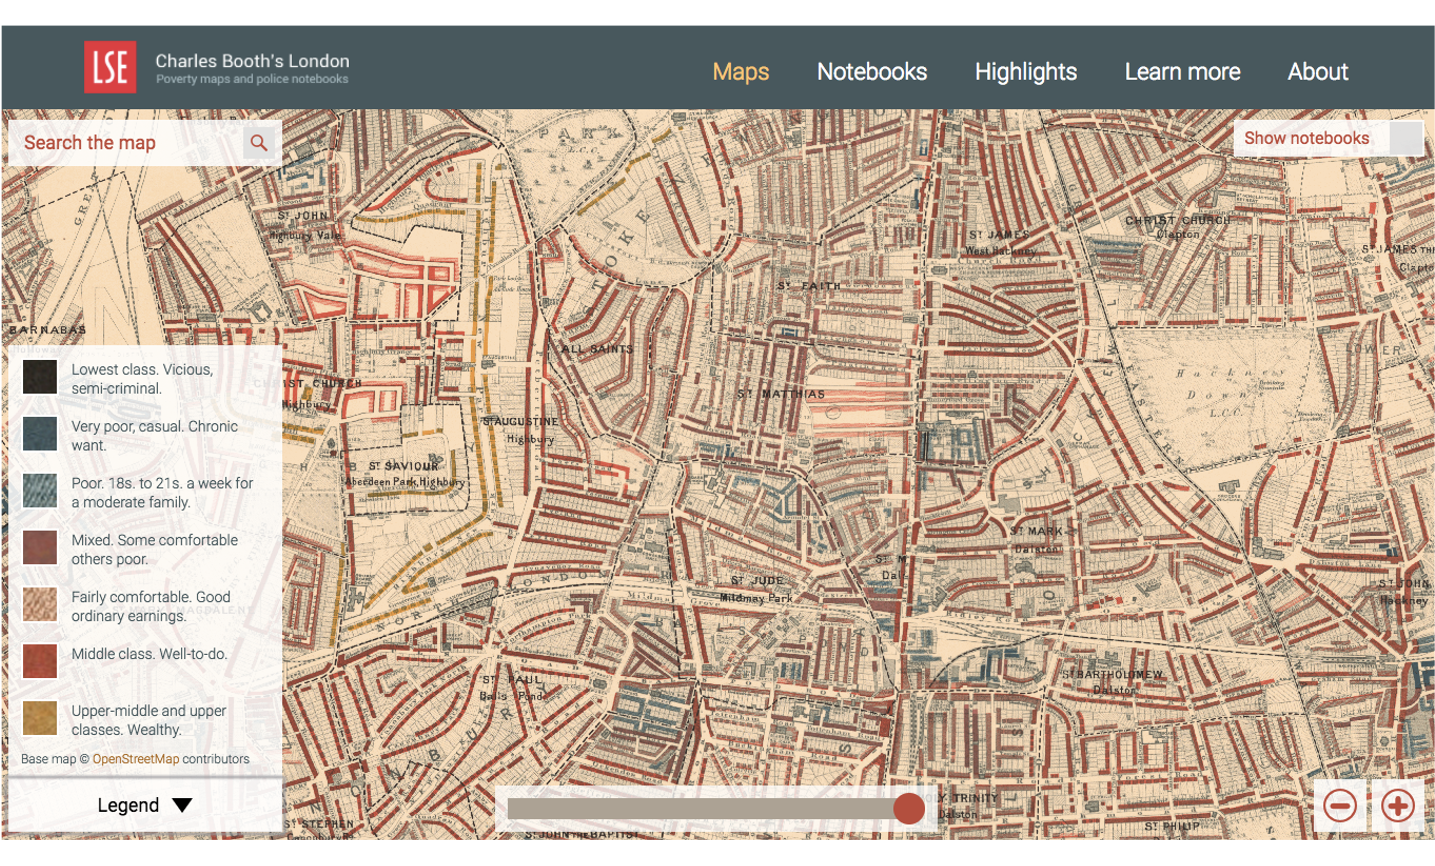
Source: booth.lse.ac.uk/map/
More than 100 Years Later
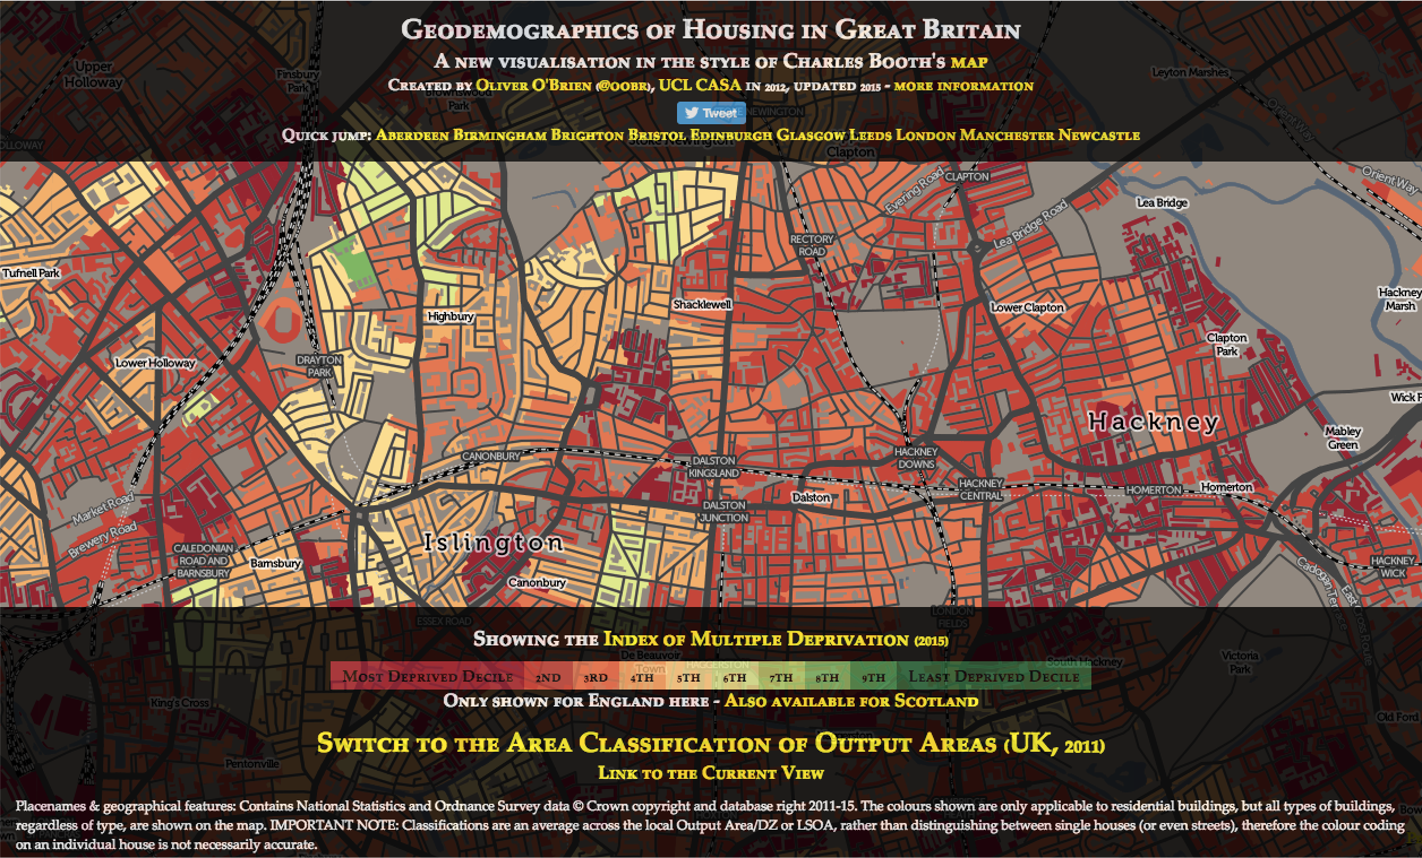
Source: vis.oobrien.com/booth/
Intimately Linked to Rise of The State
- Geodemographics only possible in context of a State – without a Census it simply wouldn’t work… until now?
- Clearly tied to social and economic ‘control’ and intervention: regeneration, poverty & exclusion, crime, etc.
- Presumes that areas are the relevant unit of analysis; in geodemographics these are usually called neighbourhoods… which should ring a few bells.
- In practice, we are in the realm of ‘homophily’, a.k.a. Tobler’s First Law of Geography
Where is it used?
Anything involving grouping individuals, households, or areas into larger ‘groups’…
- Strategic marketing (above the line, targeted, etc.)
- Retail analysis (store location, demand modelling, etc.)
- Public sector planning (resource allocation, service development, etc.)
Could see it as a subset of customer segmentation.
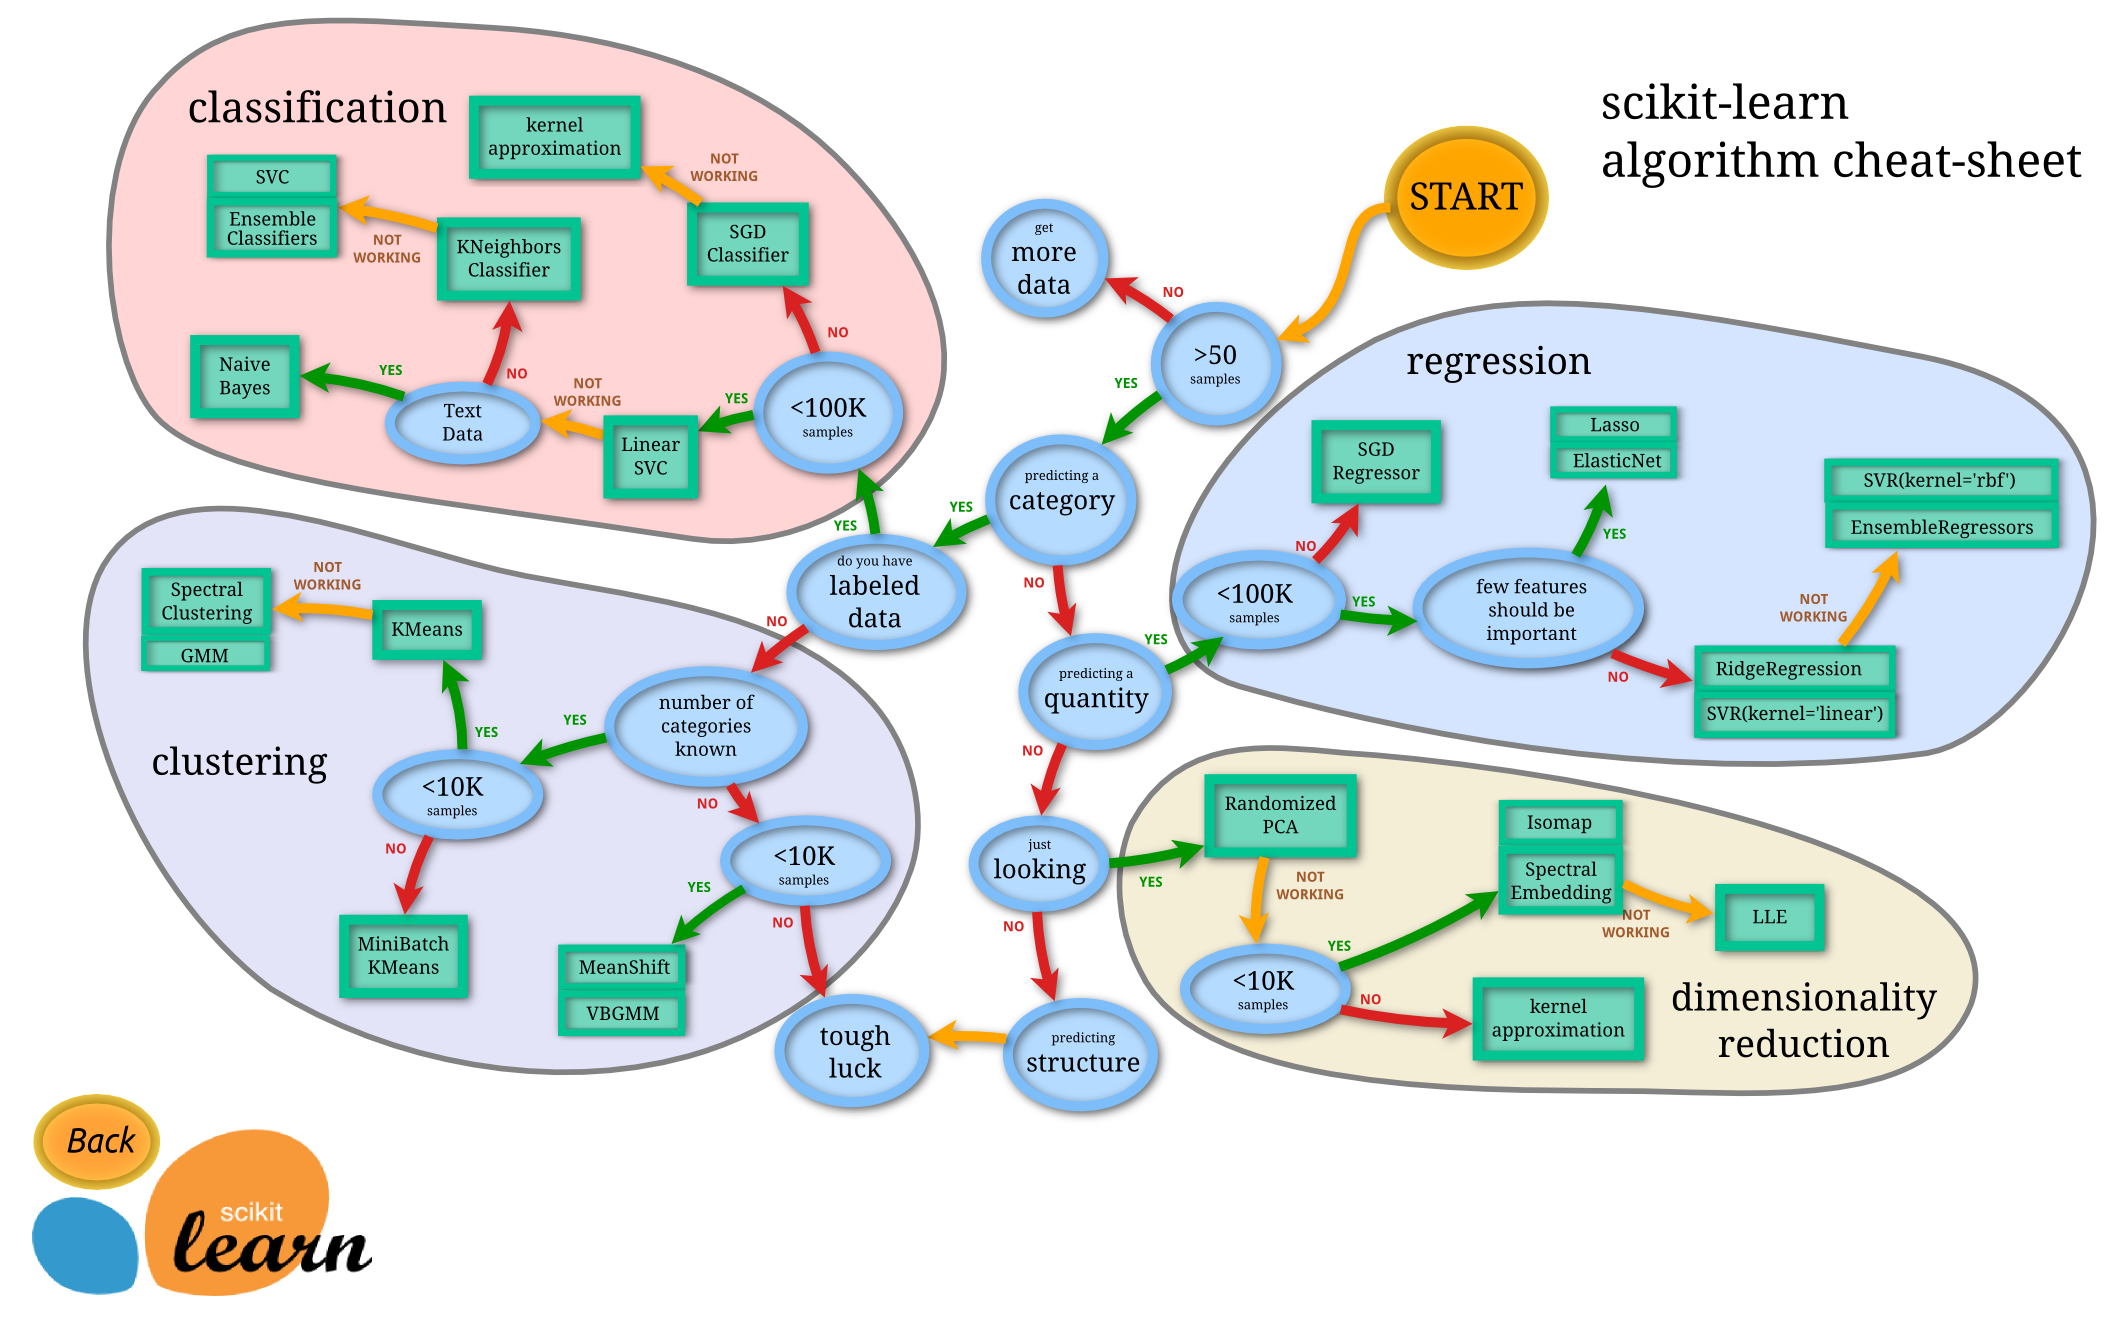
Computational Context
Problem Domains
| Continuous | Categorical | |
|---|---|---|
| Supervised | Regression | Classification |
| Unsupervised | Dimensionality Reduction | Clustering |
> What is a cluster?
> What is the purpose of clustering?
Measuring ‘Fit’
Usually working towards an ‘objective criterion’ for quality… these are known as cohesion and separation measures.
How Your Data Looks…
Clustering is one area where standardisation (and, frequently, normalisation) are essential:
- You don’t (normally) want scale in any one dimension to matter more than scale in another.
- You don’t want differences between values in one dimension to matter more than differences in another.
- You don’t want skew in one dimension to matter more than skew in another.
You also want uncorrelated variables… why?
First Steps
You will normally want a continuous variable… so these types of data are especially problematic:
- Dummies / One-Hot Encoded
- Categorical / Ordinal
- Possible solutions: k-modes, CCA, etc.
Performance
Typically about trade-offs between:
- Accuracy
- Generalisation
Trade-Offs
Need to balance:
- Ability to cluster at speed.
- Ability to replicate results.
- Ability to cope with fuzzy/indeterminate boundaries.
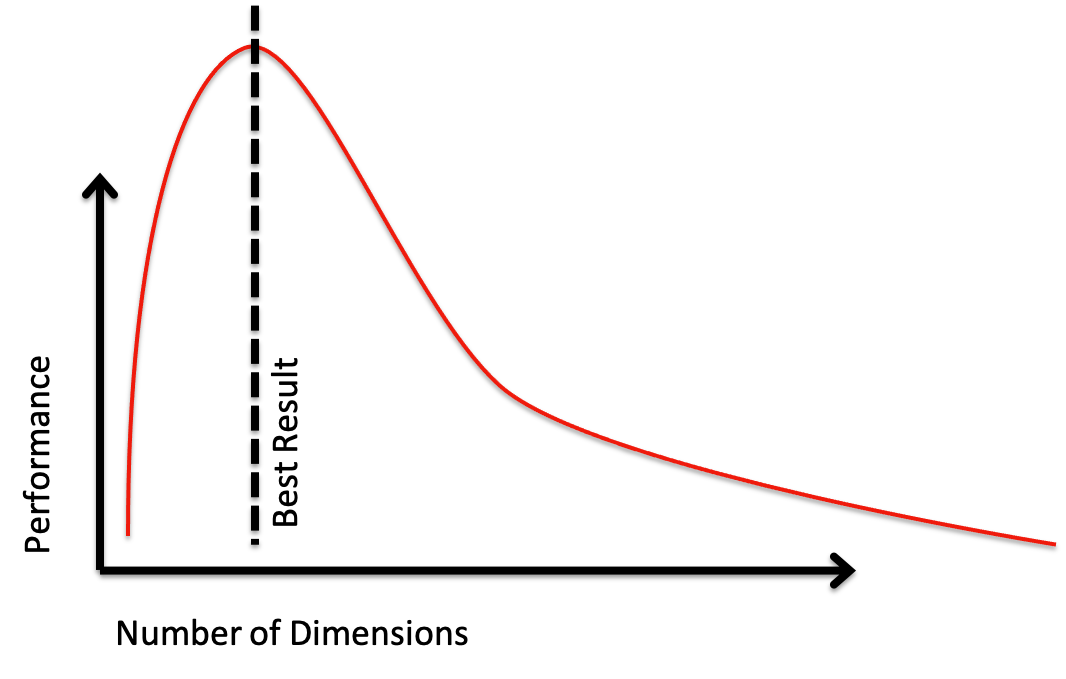
- Ability to cope with curse of dimensionality.
- Underlying representation of group membership…
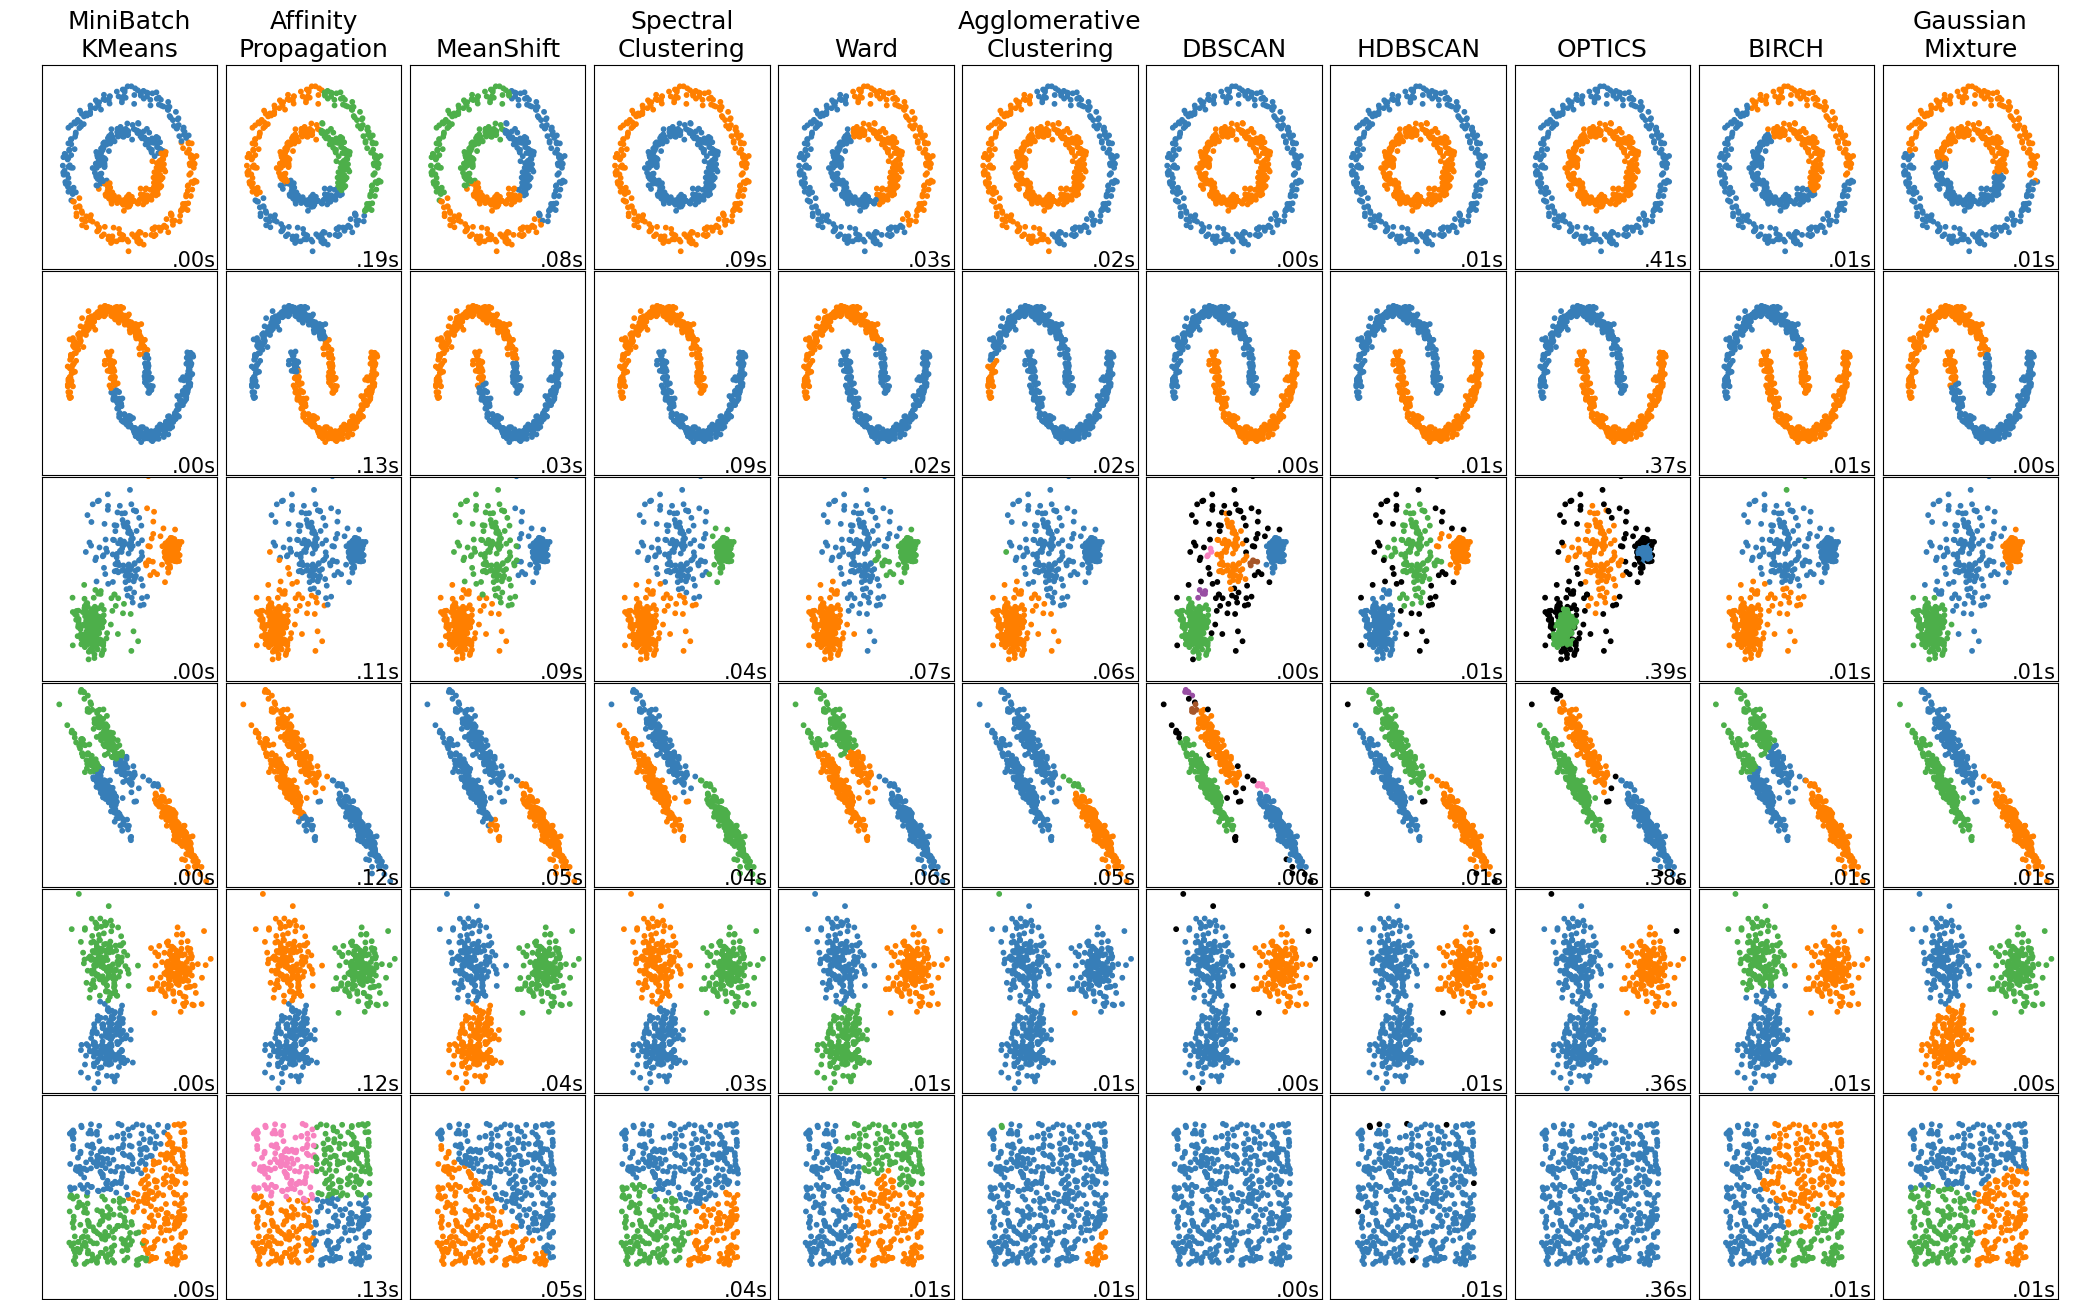
Visualising the Trade-Offs
Putting it All into Context