Clustering & Geography
Jon Reades - j.reades@ucl.ac.uk
1st October 2025
Space Adds Complexity
We now have to consider two more types of clustering:
- With respect to polygons: regions are built from adjacent zones that are more similar to one another than to other adjacent zones.
- With respect to points: points are distributed in a way that indicates ‘clumping’ at particular scales.
Trade-offs (Again)…
Consider:
- Clustering algorithms are inherently spatial.
- Clustering algorithms do not take
spacegeography into account.
Does this matter?
Different Approaches
| Algorithm | Pros | Cons | Geographically Aware? |
|---|---|---|---|
| k-Means | Fast. Deterministic. | Every observation to a cluster. | N. |
| DBSCAN | Allows for clusters and outliers. | Slower. Choice of \(\epsilon\) critical. Can end up with all outliers. | N, but implicit in \(\epsilon\). |
| OPTICS | Fewer parameters than DBSCAN. | Even slower. | N, but implicit in \(\epsilon\). |
| Hierarchical/ HDBSCAN | Can cut at any number of clusters. | No ‘ideal’ solution. | Y, with connectivity parameter. |
| ADBSCAN | Scales. Confidence levels. | May need large data set to be useful. Choice of \(\epsilon\) critical. | Y. |
| Max-p | Coherent regions returned. | Very slow if model poorly specified. | Y. |
Setting the Relevant Distance
Many clustering algorithms rely on a distance specification (usually \(\epsilon\)). So to set this threshold:
- In high-dimensional spaces this threshold will need to be large.
- In high-dimensional spaces the scale will be meaningless (i.e. not have a real-world meaning, only an abstract one).
- In 2- or 3-dimensional (geographical) space this threshold could be meaningful (i.e. a value in metres could work).
Choosing a Distance Metric
| n Dimensions | How to Set | Examples |
|---|---|---|
| 2 or 3 | Theory/Empirical Data | Walking speed; Commute distance |
| 2 or 3 | K/L Measures | Plot with Simulation for CIs to identify significant ‘knees’. |
| 3 | Marked Point Pattern? | |
| > 3 | kNN | Calculate average kNN distance based on some expectation of connectivity. |
> There is no ‘best’ clustering algorithm, it’s all about judgement.
Geodemographics as a Business
Experian
Specialist in consumer segmentation and geodemographics (bit.ly/2jMRhAW).
- Market cap: £14.3 billion.
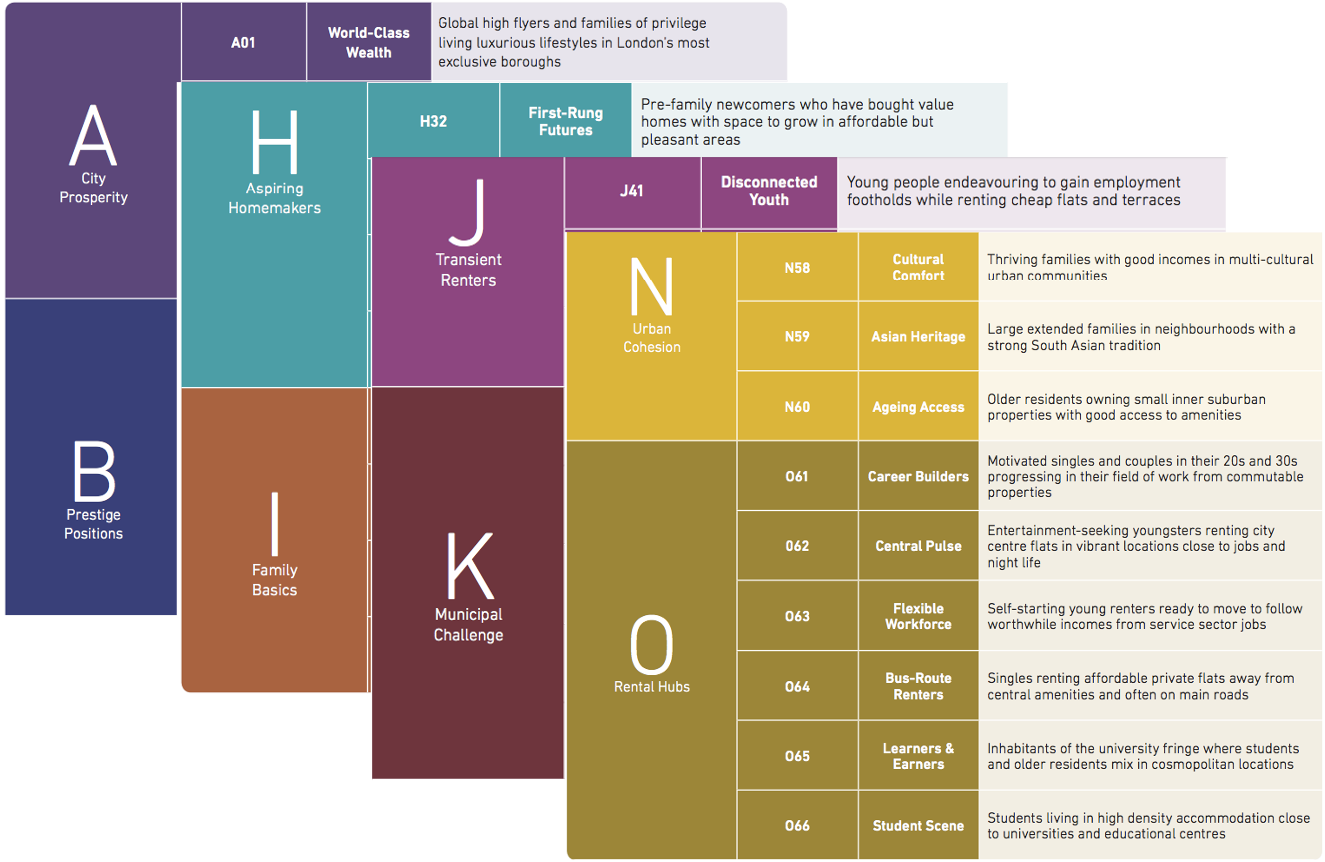
- Mosaic: “synthesises of 850 million pieces of information… to create a segmentation that allocates 49 million individuals and 26 million households into one of 15 Groups and 66 detailed Types.””
- More than 450 variables used.
Most retail companies will have their own segmentation scheme. Competitors: CACI, Nielsen, etc.
Experian Groups
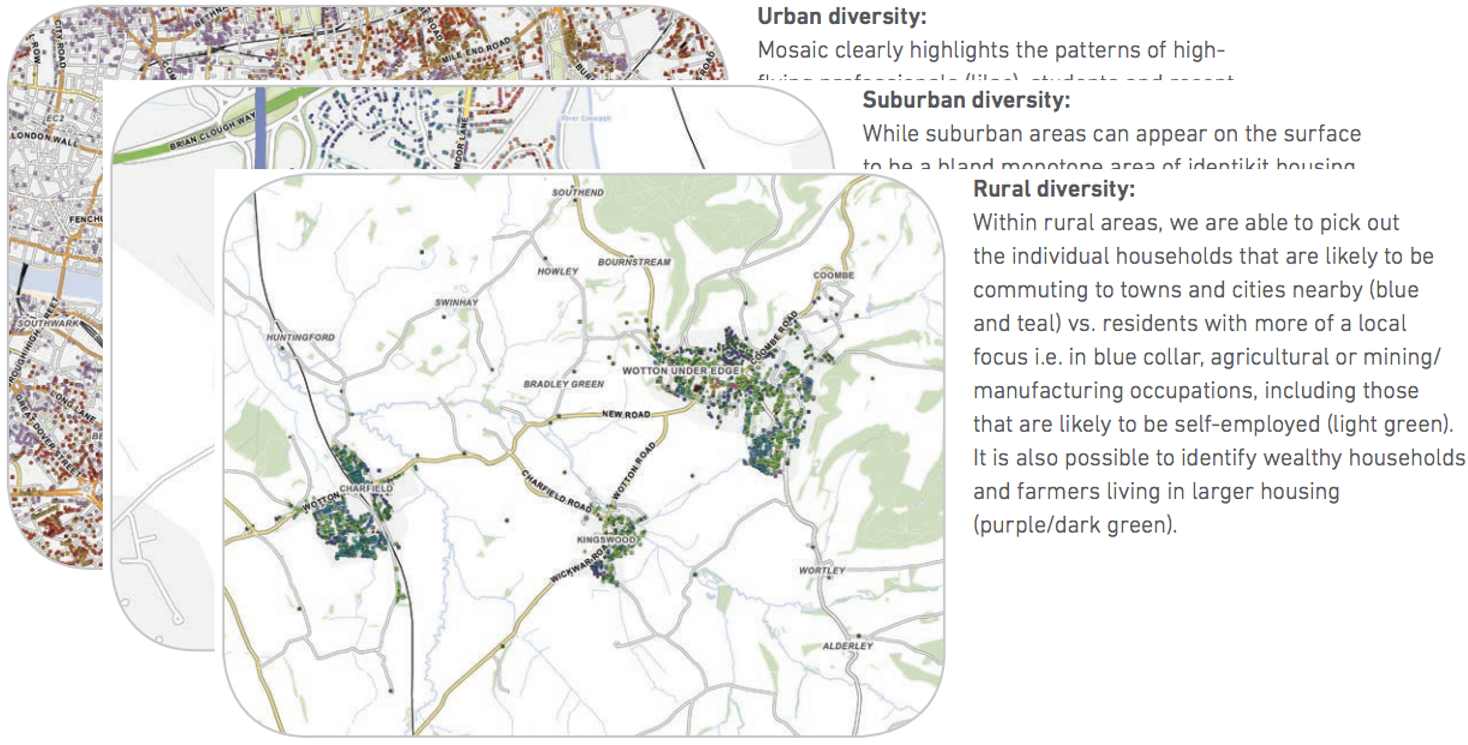
Experian Mapping
Output Area Classification
OAC set up as ‘open source’ alternative to Mosaic:
- Well documented (UCL Geography a major contributor)
- Doesn’t require a license or payment
- Can be tweaked/extended/reweighted by users as needed


