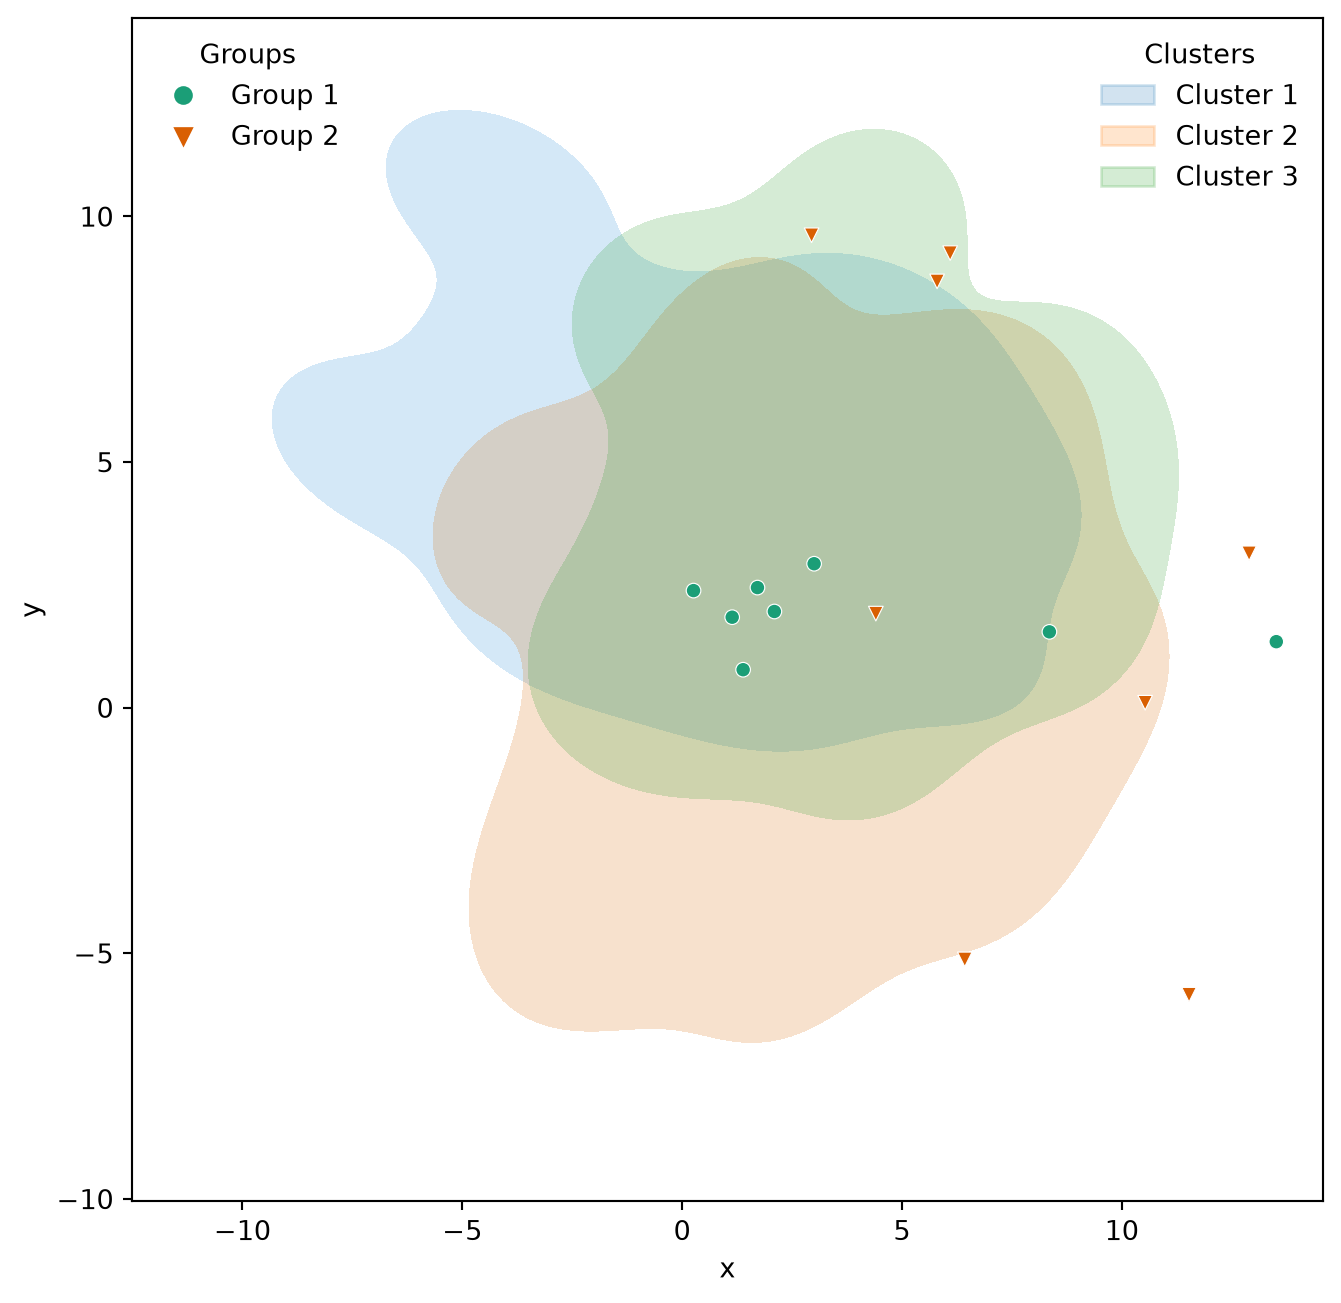
import numpy as np
import pandas as pd
import seaborn as sns
import matplotlib.pyplot as plt

# We will need to access some of these matplotlib classes directly\
from matplotlib.lines import Line2D # For points and lines\
from matplotlib.patches import Patch # For KDE and other plots\
from matplotlib.legend import Legend
import matplotlib as m

# Initialise random number generator
rng = np.random.default_rng(seed=42)

# Generate sample of 25 numbers\
n = 25

clusters = []

for c in range(0,3):
    # Crude way to get different distributions
    # for each cluster
    p = rng.integers(low=1, high=6, size=4)
    df = pd.DataFrame({
        'x': rng.normal(p[0], p[1], n),
        'y': rng.normal(p[2], p[3], n),
        'name': f"Cluster {c+1}"
    })
    clusters.append(df)

# Flatten to a single data frame
clusters = pd.concat(clusters)

# Now do the same for data to feed into
# the second (scatter) plot...
n = 8
points = []

for c in range(0,2):
    p = rng.integers(low=1, high=6, size=4)
    df = pd.DataFrame({
        'x': rng.normal(p[0], p[1], n),
        'y': rng.normal(p[2], p[3], n),
        'name': f"Group {c+1}"
    })
    points.append(df)

points = pd.concat(points)

# And create the figure\
f, ax = plt.subplots(figsize=(8,8))

# The KDE-plot generates a Legend 'as usual'
k = sns.kdeplot(
    data=clusters,
    x='x', y='y',
    hue='name',
    shade=True,
    thresh=0.05,
    n_levels=2,
    alpha=0.2,
    ax=ax,
)

# Notice that we access this legend via the
# axis to turn off the frame, set the title,
# and adjust the patch alpha level so that
# it closely matches the alpha of the KDE-plot
ax.get_legend().set_frame_on(False)
ax.get_legend().set_title("Clusters")
for lh in ax.get_legend().get_patches():
    lh.set_alpha(0.2)

# You would probably want to sort your data
# frame or set the hue and style order in order
# to ensure consistency for your own application
# but this works for demonstration purposes
groups = points.name.unique()
markers = ['o', 'v', 's', 'X', 'D', '<', '>']
colors = m.colormaps.get_cmap('Dark2').colors

# Generate the scatterplot: notice that Legend is
# off (otherwise this legend would overwrite the
# first one) and that we're setting the hue, style,
# markers, and palette using the 'name' parameter
# from the data frame and the number of groups in
# the data.
p = sns.scatterplot(
    data=points,
    x="x",
    y="y",
    hue='name',
    style='name',
    markers=markers[:len(groups)],
    palette=colors[:len(groups)],
    legend=False,
    s=30,
    alpha=1.0
)

# Here's the 'magic' -- we use zip to link together
# the group name, the color, and the marker style. You
# *cannot* retrieve the marker style from the scatterplot
# since that information is lost when rendered as a
# PathCollection (as far as I can tell). Anyway, this allows
# us to loop over each group in the second data frame and
# generate a 'fake' Line2D plot (with zero elements and no
# line-width in our case) that we can add to the legend. If
# you were overlaying a line plot or a second plot that uses
# patches you'd have to tweak this accordingly.
patches = []
for x in zip(groups, colors[:len(groups)], markers[:len(groups)]):
    patches.append(Line2D([0],[0], linewidth=0.0, linestyle='',
    color=x[1], markerfacecolor=x[1],
    marker=x[2], label=x[0], alpha=1.0))

# And add these patches (with their group labels) to the new
# legend item and place it on the plot.
leg = Legend(ax, patches, labels=groups,
    loc='upper left', frameon=False, title='Groups')
ax.add_artist(leg);

# Done
plt.show();