Counting the cost of gentrification?
Dr. Jon Reades
6 July
London: Aspects of Change
#RuthGlass60


Test/Control
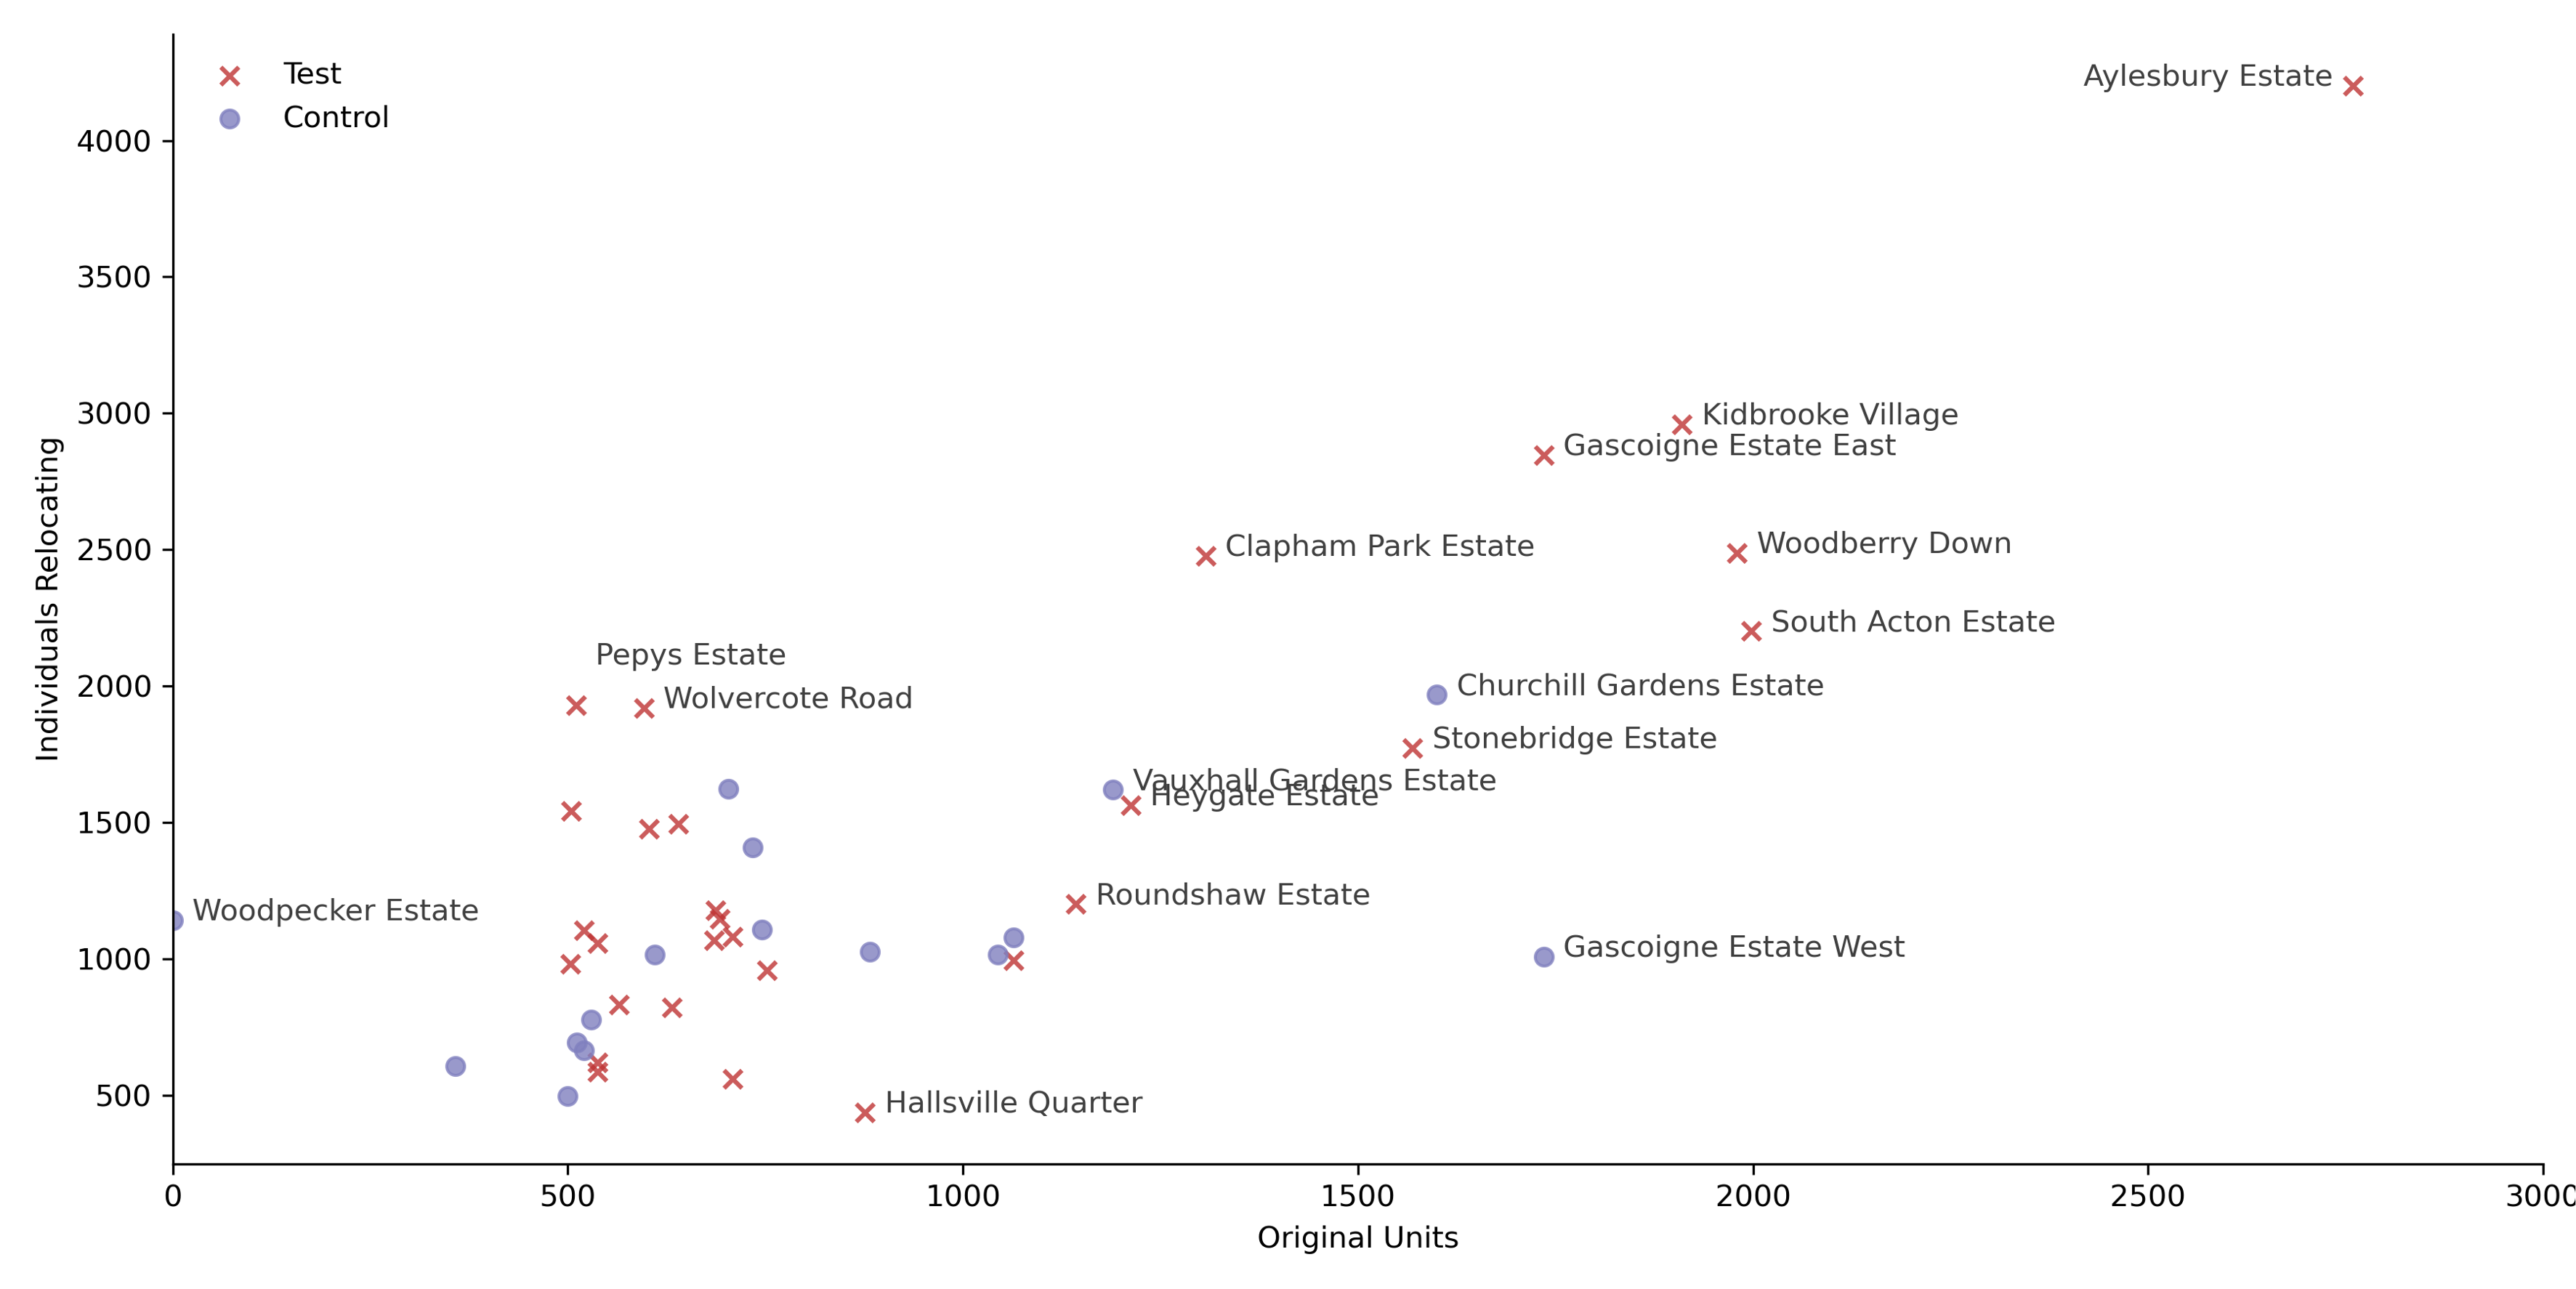
Comparison of units to number of detected relocations (Reades et al., 2023)
Distance
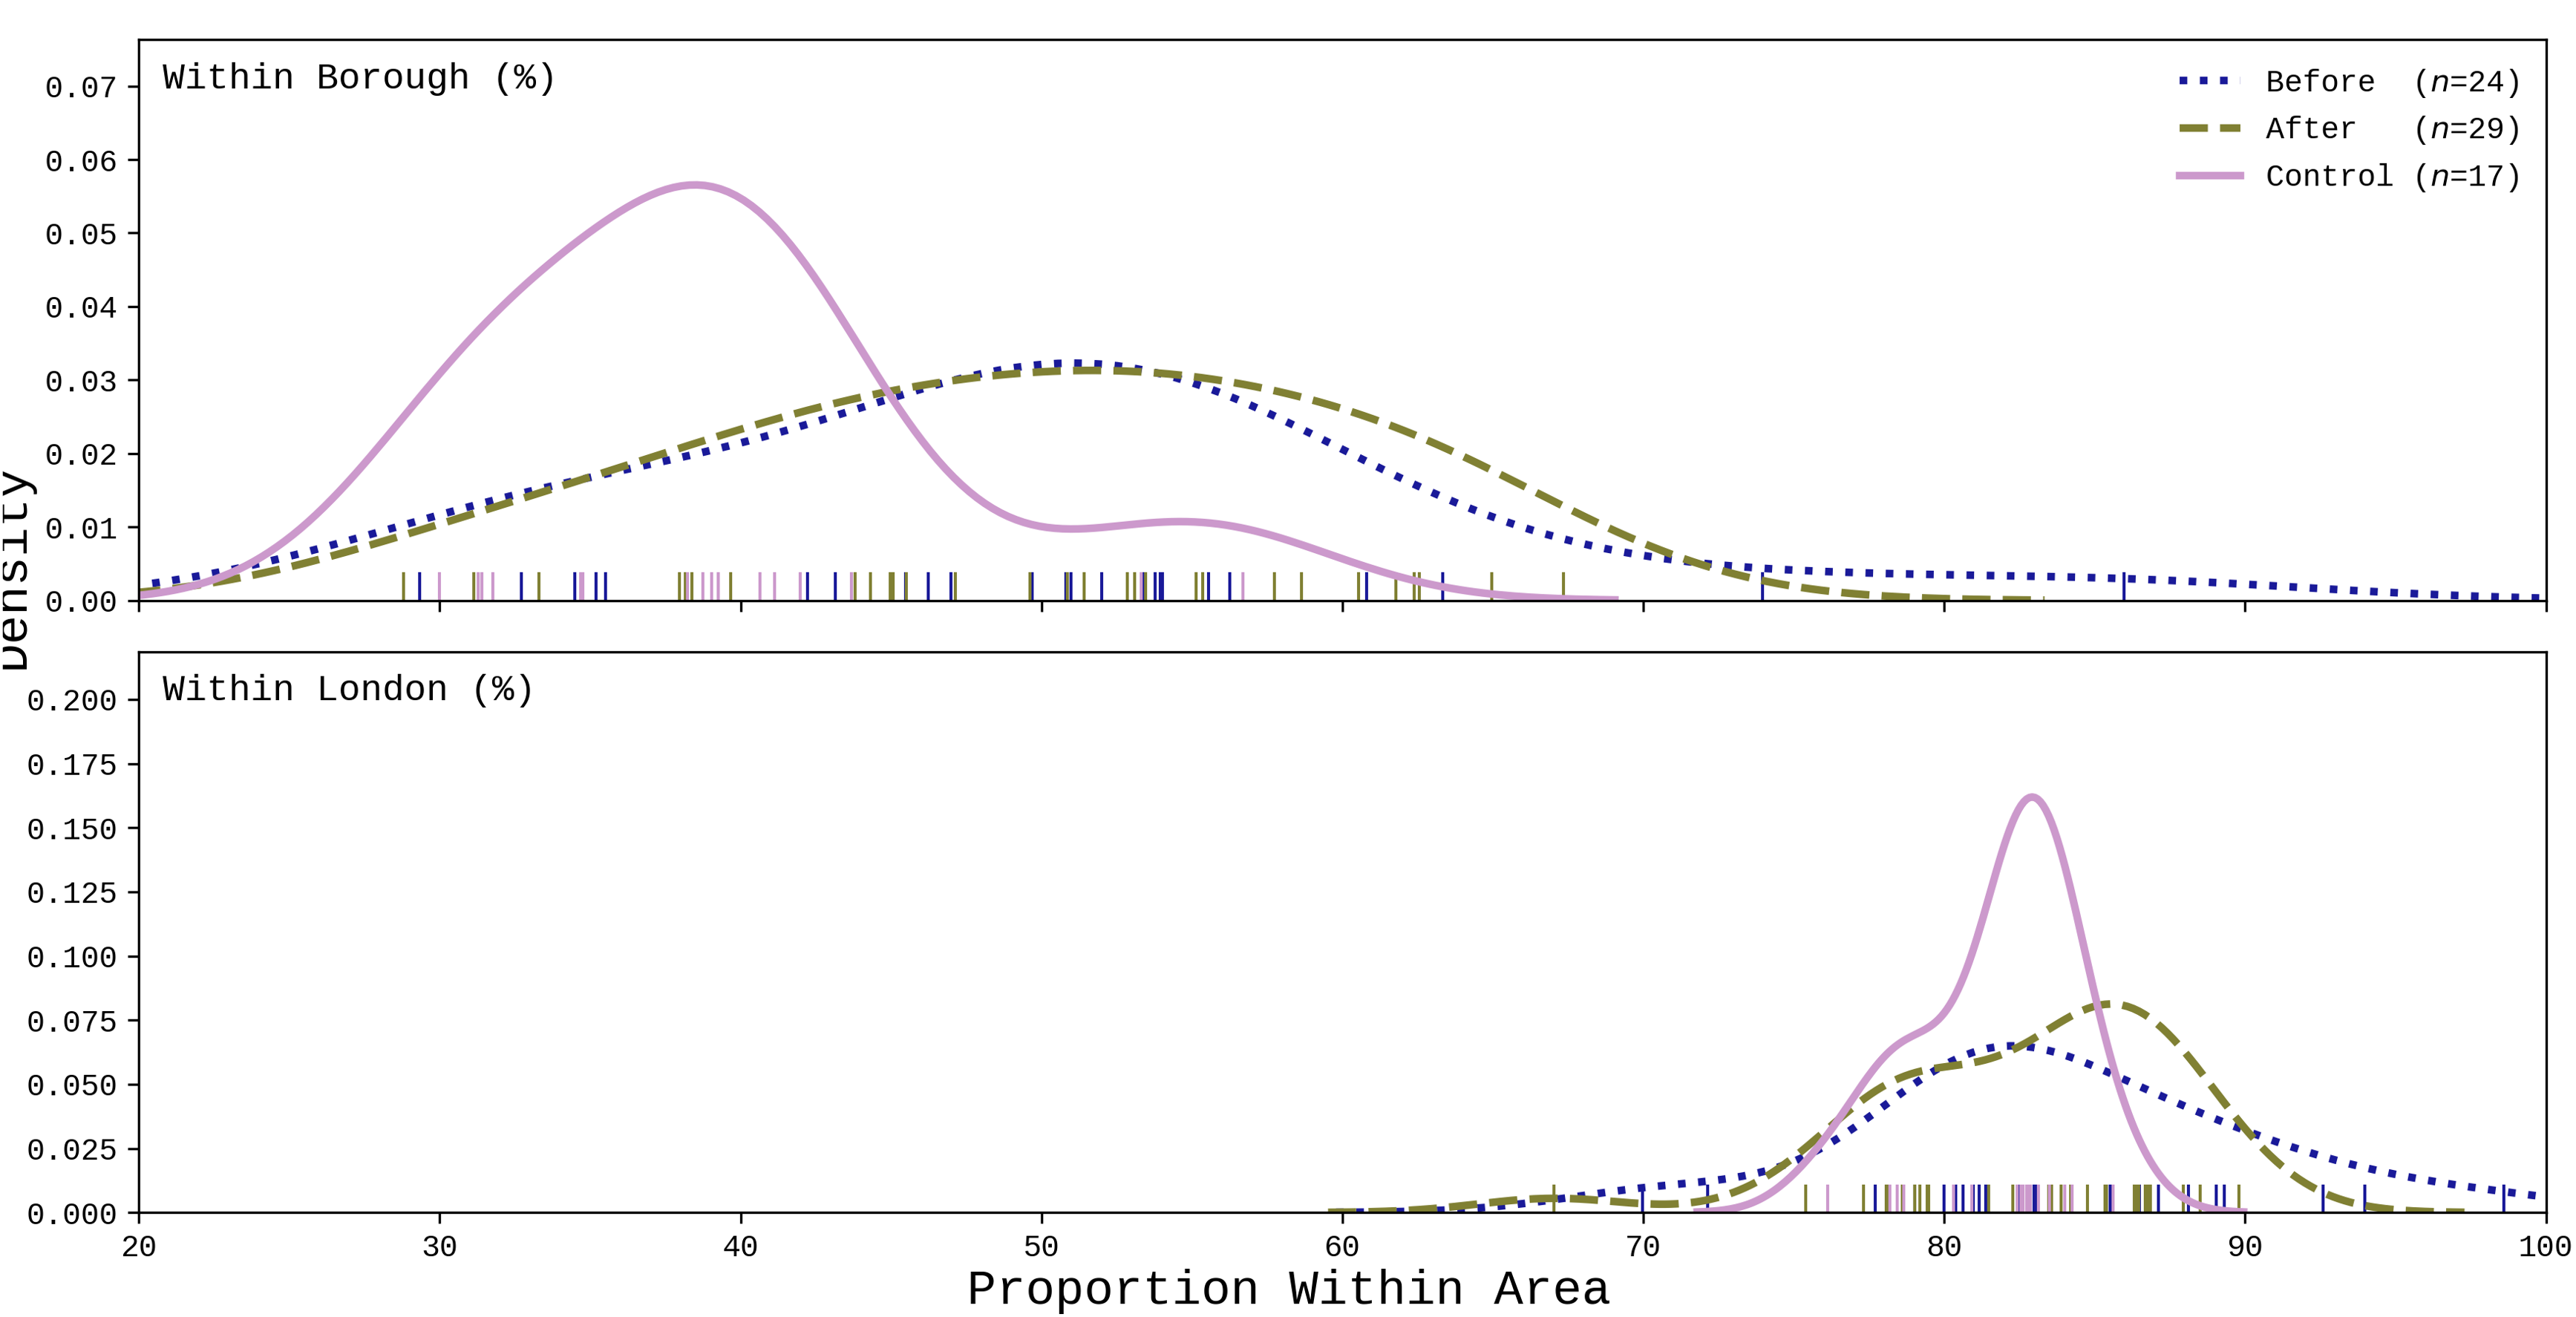
Proportion of relocations within administrative area (Reades et al., 2023)
Time
| Q1 | Q2 | Q3 | Q4 | Q5 | ||
|---|---|---|---|---|---|---|
| Spitalfields and Banglatown | In-movers | 0.228 | 0.353 | 0.182 | 0.135 | 0.103 |
| Out-movers | 0.251 | 0.389 | 0.164 | 0.112 | 0.084 | |
| Whitechapel | In-movers | 0.230 | 0.338 | 0.185 | 0.014 | 0.106 |
| Out-movers | 0.255 | 0.360 | 0.172 | 0.124 | 0.089 | |
| Hoxton East and Shoreditch | In-movers | 0.209 | 0.324 | 0.200 | 0.146 | 0.120 |
| Out-movers | 0.232 | 0.355 | 0.186 | 0.130 | 0.096 |
Note: Quintile 1 is the most deprived quintile, quintile 5 is the least deprived quintile.
:::
Context and Confidence
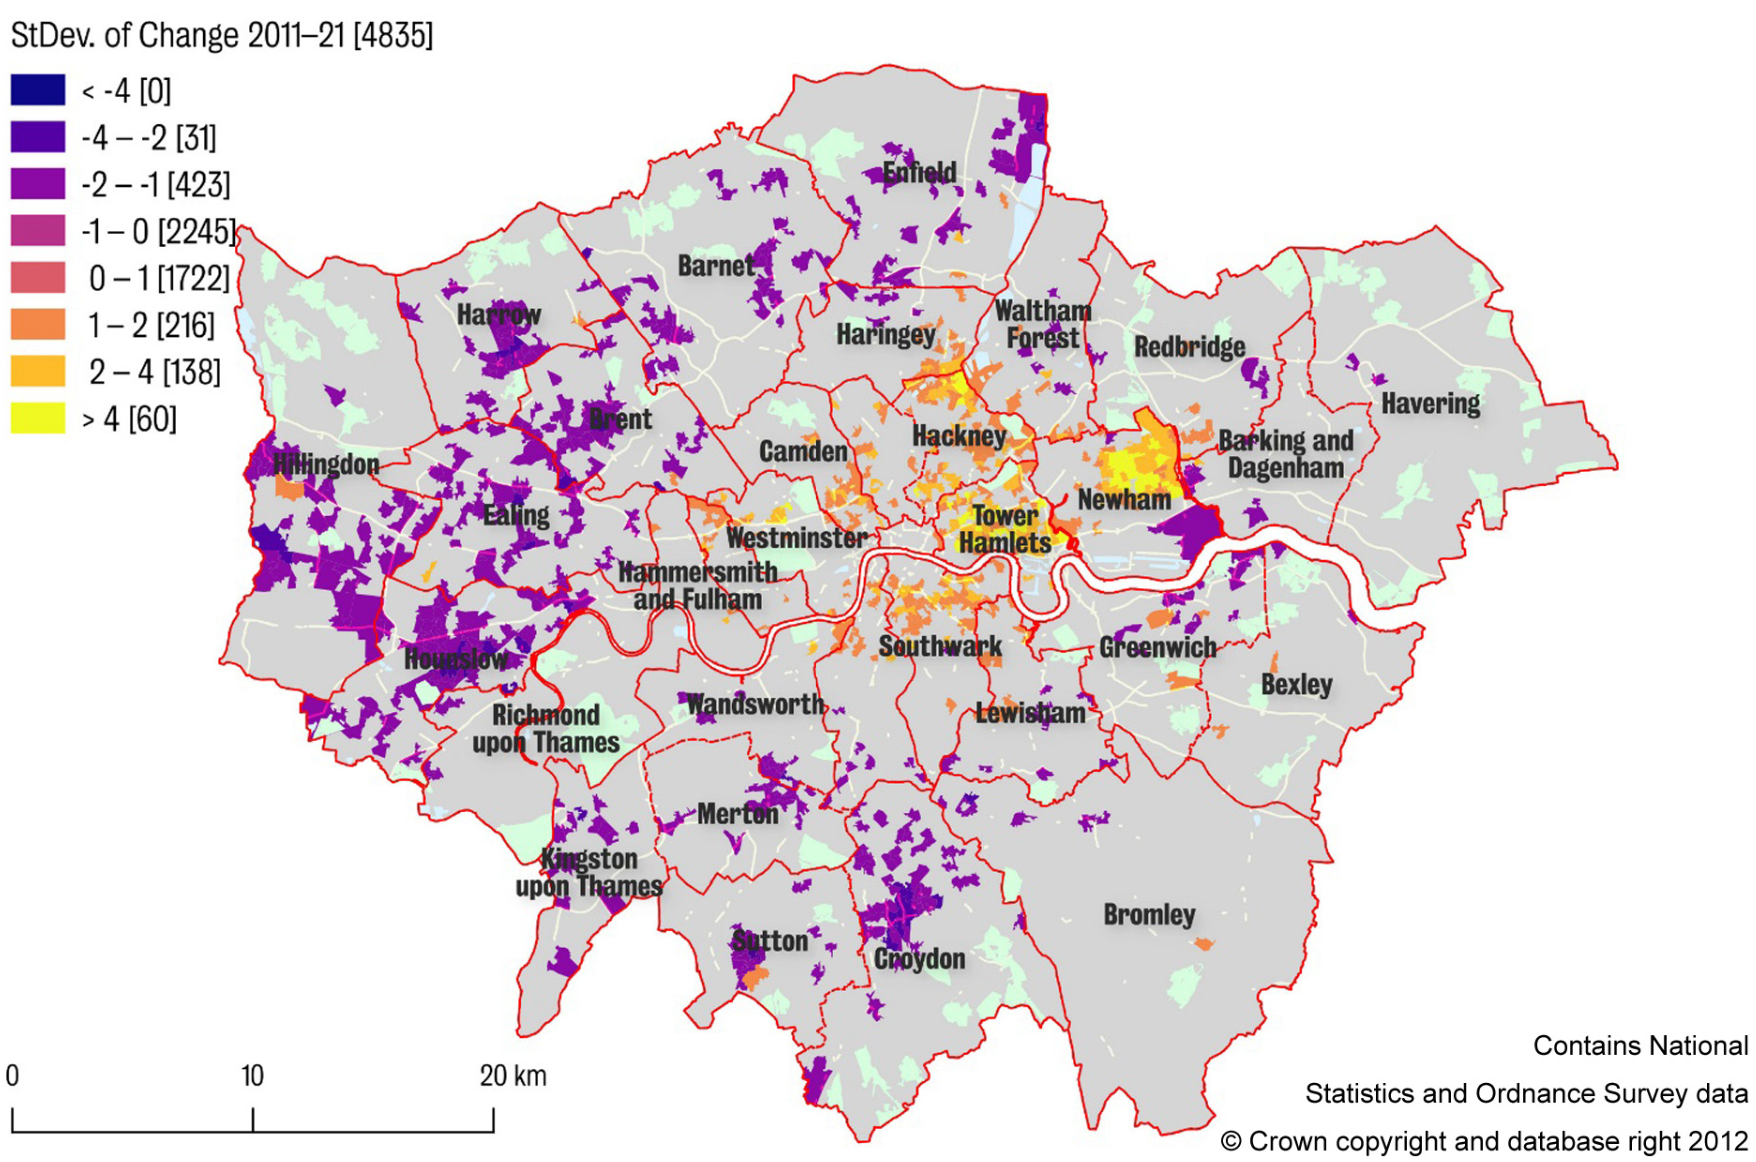
Standard deviation of change in rank 2001–2011 (Reades, De Souza and Hubbard, 2019)
<Prediction
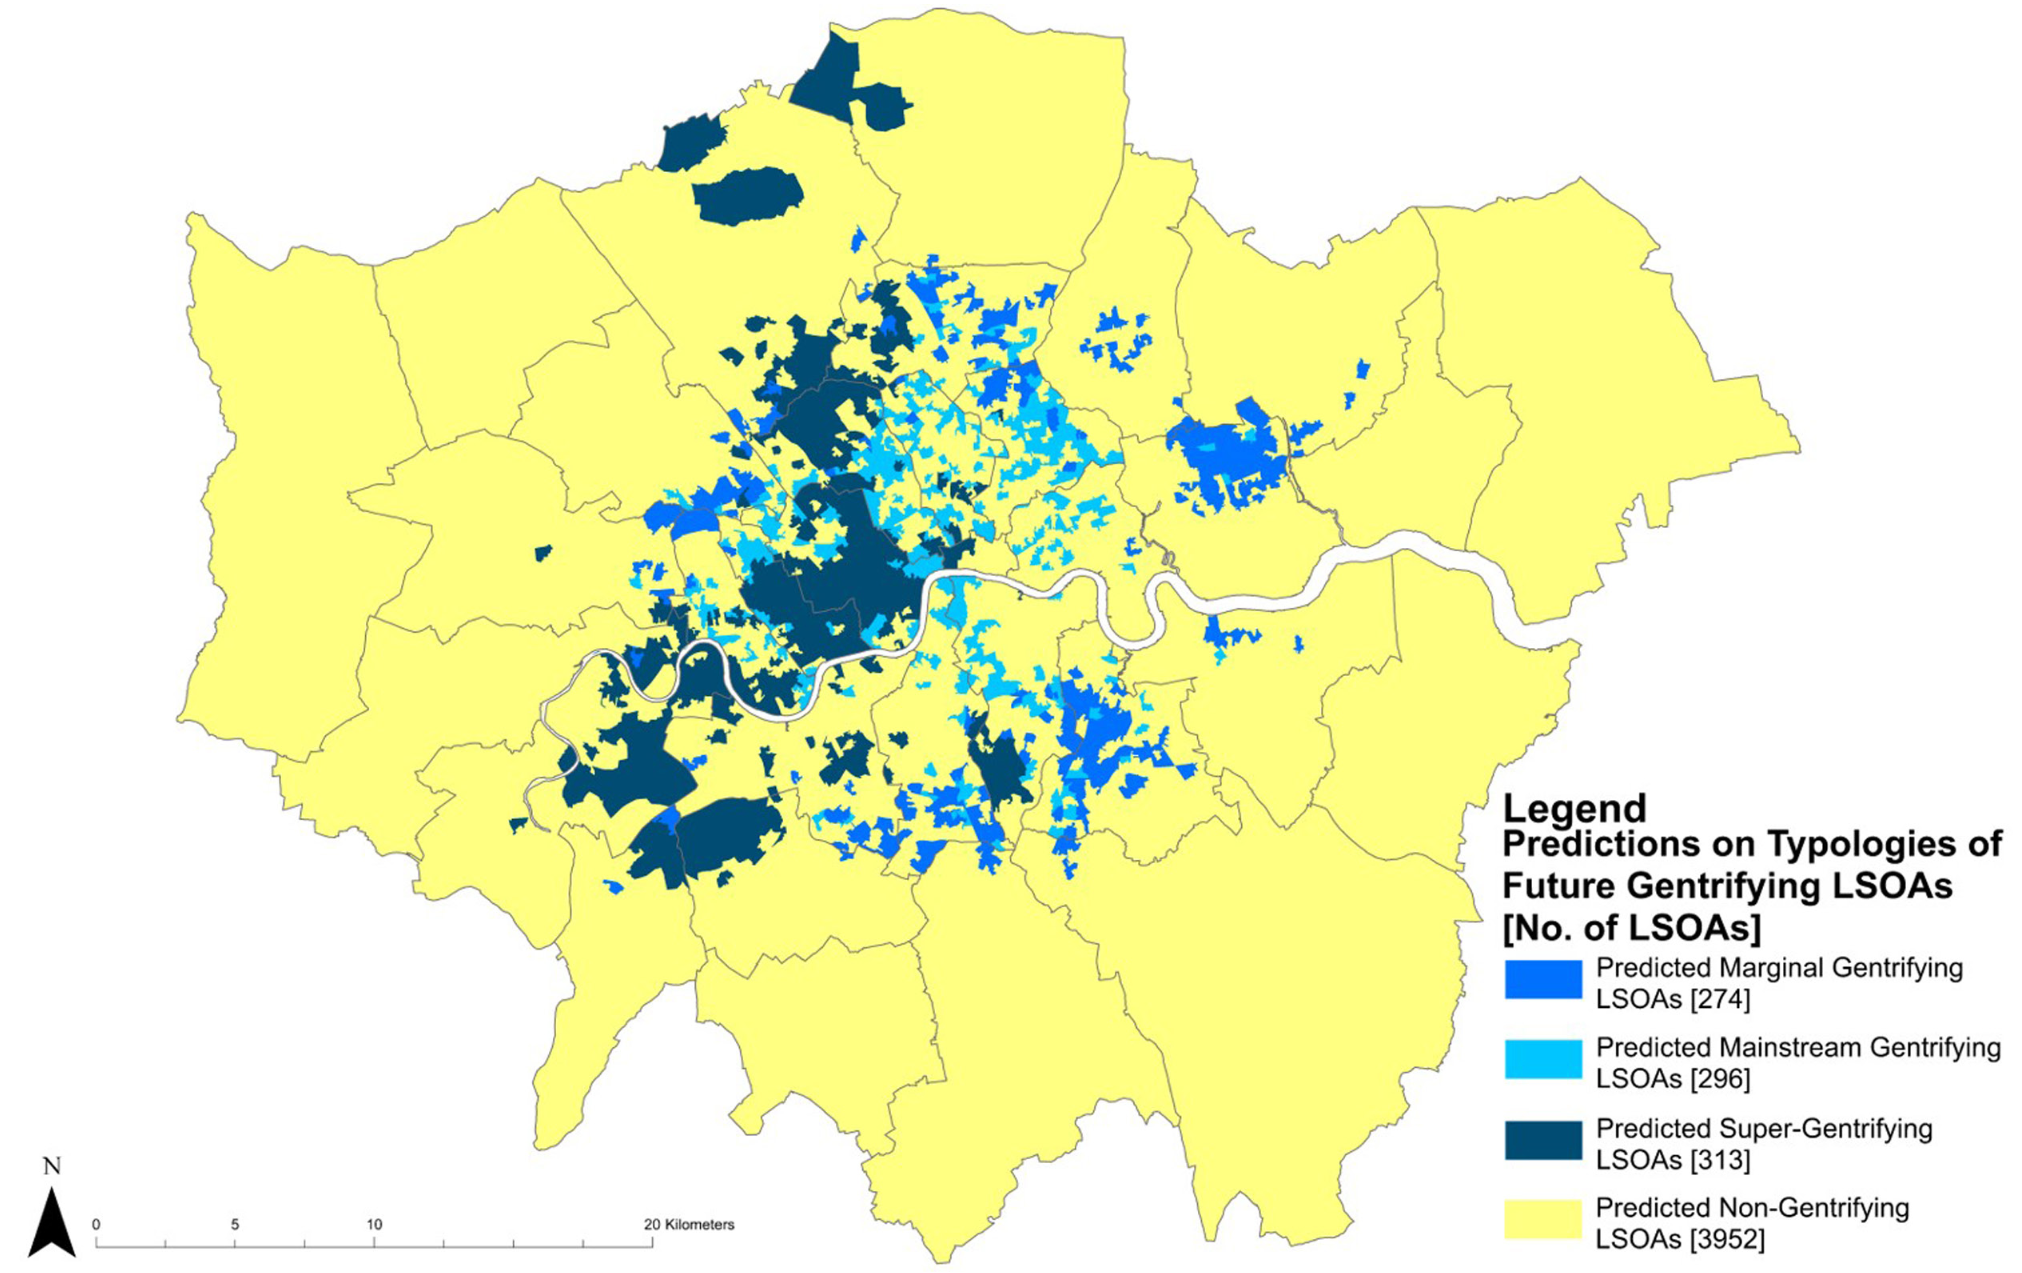
Predicted typologies of future gentrifying LSOAs (Yee and Dennett, 2022)
One more thing…

Gentrification Bingo time!
- Paper of record for global elite
- Scene from a brewery
- On land now owned by Blackrock
- Which has successfully applied to redevelop
- Photo by the new precariat
- Who is resident (?) in local area
- … and …
- Academic just out of frame
Questions?
A partial bibliography
Almeida, A. (2021) Pushed to the Margins. Runnymede Trust. Available at: https://www.runnymedetrust.org/publications/pushed-to-the-margins.
Atkinson, R. (2000) “Measuring gentrification and displacement in Greater London,” Urban studies, 37(1), pp. 149–165.
Barton, M. (2016) “An exploration of the importance of the strategy used to identify gentrification,” Urban Studies, 53(1), pp. 92–111.
Chng, I., Reades, J. and Hubbard, P. (2024) “Planning deregulation as solution to the housing crisis: The affordability, amenity and adequacy of Permitted Development in London,” Environment and Planning A: Economy and Space, 56(3), pp. 961–978. doi: 10.1177/0308518X231209982.
Hamnett, C. (2003) “Gentrification and the Middle-class Remaking of Inner London, 1961-2001,” Urban Studies, 40(12), pp. 2401–2426. doi: 10.1080/0042098032000136138.
Hubbard, P. et al. (2024) “Shrinking homes? The geographies of small domestic properties in London, 2010–2021,” Environment and Planning B: Urban Analytics and City Science, 51(5), pp. 1137–1152. doi: 10.1177/23998083231208732.
Hubbard, P., Reades, J. and Walter, H. (2021) “Housing: Shrinking homes, COVID-19 and the challenge of homeworking,” Town Planning Review, 92(1), pp. 3–10. doi: 10.3828/tpr.2020.46.
Neal, S. et al. (2016) “‘You can’t move in Hackney without bumping into an anthropologist’: why certain places attract research attention,” Qualitative Research, 16(5), pp. 491–507.
Reades, J. et al. (2023) “Quantifying state-led gentrification in London: Using linked consumer and administrative records to trace displacement from council estates,” Environment and Planning A: Economy and Space, 55(4), pp. 810–827. doi: 10.1177/0308518X221135610.
Reades, J., De Souza, J. and Hubbard, P. (2019) “Understanding urban gentrification through machine learning,” Urban Studies, 56(5), pp. 922–942. doi: 10.1177/0042098018789054.
Slater, T. (2010) “Still missing Marcuse: Hamnett’s foggy analysis in London town,” City, 14(1-2), pp. 170–179. doi: 10.1080/13604811003633719.
van Dijk, J., Lansley, G. and Longley, P. (2021) “Using linked consumer and administrative data to model demographic changes in londons city fringe,” in Big data applications in geography and planning. Edward Elgar Publishing, pp. 43–51.
Watt, P. (2008) “The Only Class in Town? Gentrification and the Middle-Class Colonization of the City and the Urban Imagination,” International Journal of Urban and Regional Research, 32(1), pp. 206–211. doi: https://doi.org/10.1111/j.1468-2427.2008.00769.x.
Yee, J. and Dennett, A. (2022) “Stratifying and predicting patterns of neighbourhood change and gentrification: An urban analytics approach,” Transactions of the Institute of British Geographers, 47(3), pp. 770–790. doi: 10.1111/tran.12522.
![]()