Pandas is probably (together with scipy, numpy, and sklearn) the main reason that Python has become popular for data science. According to ‘Learn Data Sci’ it accounts for 1% of all Stack Overflow question views!
import pandas as pd # import package# Bitly: https://raw.githubusercontent.com/jreades/fsds/master/data/2019-sample-crime.csvurl='https://bit.ly/39SJpfp'df = pd.read_csv(url) # load a (remote) CSVprint(type(df)) # not simple data typeprint(df.columns.to_list()) # column namesprint(df.columns.values) # Also works but deprecated
df.info is more about data types and memory usage. df.describe is for summarising information about the distribution of values in every series.
df.describe() # Information about each Series
ID
Year
Latitude
Longitude
count
1.000000e+02
100.0
100.000000
100.000000
mean
1.172479e+07
2019.0
41.845500
-87.674197
std
1.056492e+05
0.0
0.083776
0.055893
min
1.155667e+07
2019.0
41.666091
-87.836650
25%
1.163515e+07
2019.0
41.773812
-87.716710
50%
1.171914e+07
2019.0
41.866925
-87.669222
75%
1.180549e+07
2019.0
41.902087
-87.631061
max
1.193442e+07
2019.0
42.019399
-87.551446
df.info() # Information about each Series and the df
<class 'pandas.core.frame.DataFrame'>
RangeIndex: 100 entries, 0 to 99
Data columns (total 11 columns):
 #   Column                Non-Null Count  Dtype
---  ------                --------------  -----
 0   ID                    100 non-null    int64
 1   Case Number           100 non-null    object
 2   Date                  100 non-null    object
 3   Primary Type          100 non-null    object
 4   Description           100 non-null    object
 5   Location Description  97 non-null     object
 6   Arrest                100 non-null    bool
 7   Domestic              100 non-null    bool
 8   Year                  100 non-null    int64
 9   Latitude              100 non-null    float64
 10  Longitude             100 non-null    float64
dtypes: bool(2), float64(2), int64(2), object(5)
memory usage: 7.4+ KB
Familiar?
This should be looking eerily familiar:
print(type(df['Latitude'])) # type for columnprint(type(df['Latitude'].array)) # type for valuesprint(df['Latitude'].array[:5]) # first five valuesprint(f"1: {df['Latitude'].mean()}") # summarise a series/columnprint(f"2: {df.Latitude.mean()}") # if no spaces in name
Pandas is also ‘Jupyter-aware’, meaning that output can displayed directly in Jupyter in ‘fancy’ ways:
df.head(4)
ID
Case Number
Date
Primary Type
Description
Location Description
Arrest
Domestic
Year
Latitude
Longitude
0
11667185
JC237601
04/20/2019 11:00:00 PM
BURGLARY
FORCIBLE ENTRY
COMMERCIAL / BUSINESS OFFICE
False
False
2019
41.751307
-87.603468
1
11909178
JC532226
12/02/2019 10:35:00 AM
DECEPTIVE PRACTICE
FRAUD OR CONFIDENCE GAME
GROCERY FOOD STORE
False
False
2019
41.903997
-87.643230
2
11852571
JC462365
10/06/2019 04:50:00 PM
BATTERY
AGGRAVATED DOMESTIC BATTERY - OTHER DANGEROUS ...
CLEANING STORE
True
True
2019
41.880329
-87.758473
3
11804855
JC405161
08/23/2019 10:00:00 PM
THEFT
OVER $500
STREET
False
False
2019
41.924384
-87.641442
Familiar?
df.head(2) # First 2 rows of df
ID
Case Number
Date
Primary Type
Description
Location Description
Arrest
Domestic
Year
Latitude
Longitude
0
11667185
JC237601
04/20/2019 11:00:00 PM
BURGLARY
FORCIBLE ENTRY
COMMERCIAL / BUSINESS OFFICE
False
False
2019
41.751307
-87.603468
1
11909178
JC532226
12/02/2019 10:35:00 AM
DECEPTIVE PRACTICE
FRAUD OR CONFIDENCE GAME
GROCERY FOOD STORE
False
False
2019
41.903997
-87.643230
df[['ID','Date','Year']].tail(2) # Last 2 rows of selected columns
ID
Date
Year
98
11760201
07/16/2019 04:16:00 PM
2019
99
11648994
04/08/2019 11:10:00 PM
2019
df.sample(frac=0.3) # A random 30% sampledf.sample(3, random_state=42) # A random sample with a seeddf.sample(3, random_state=42) # Same sample!
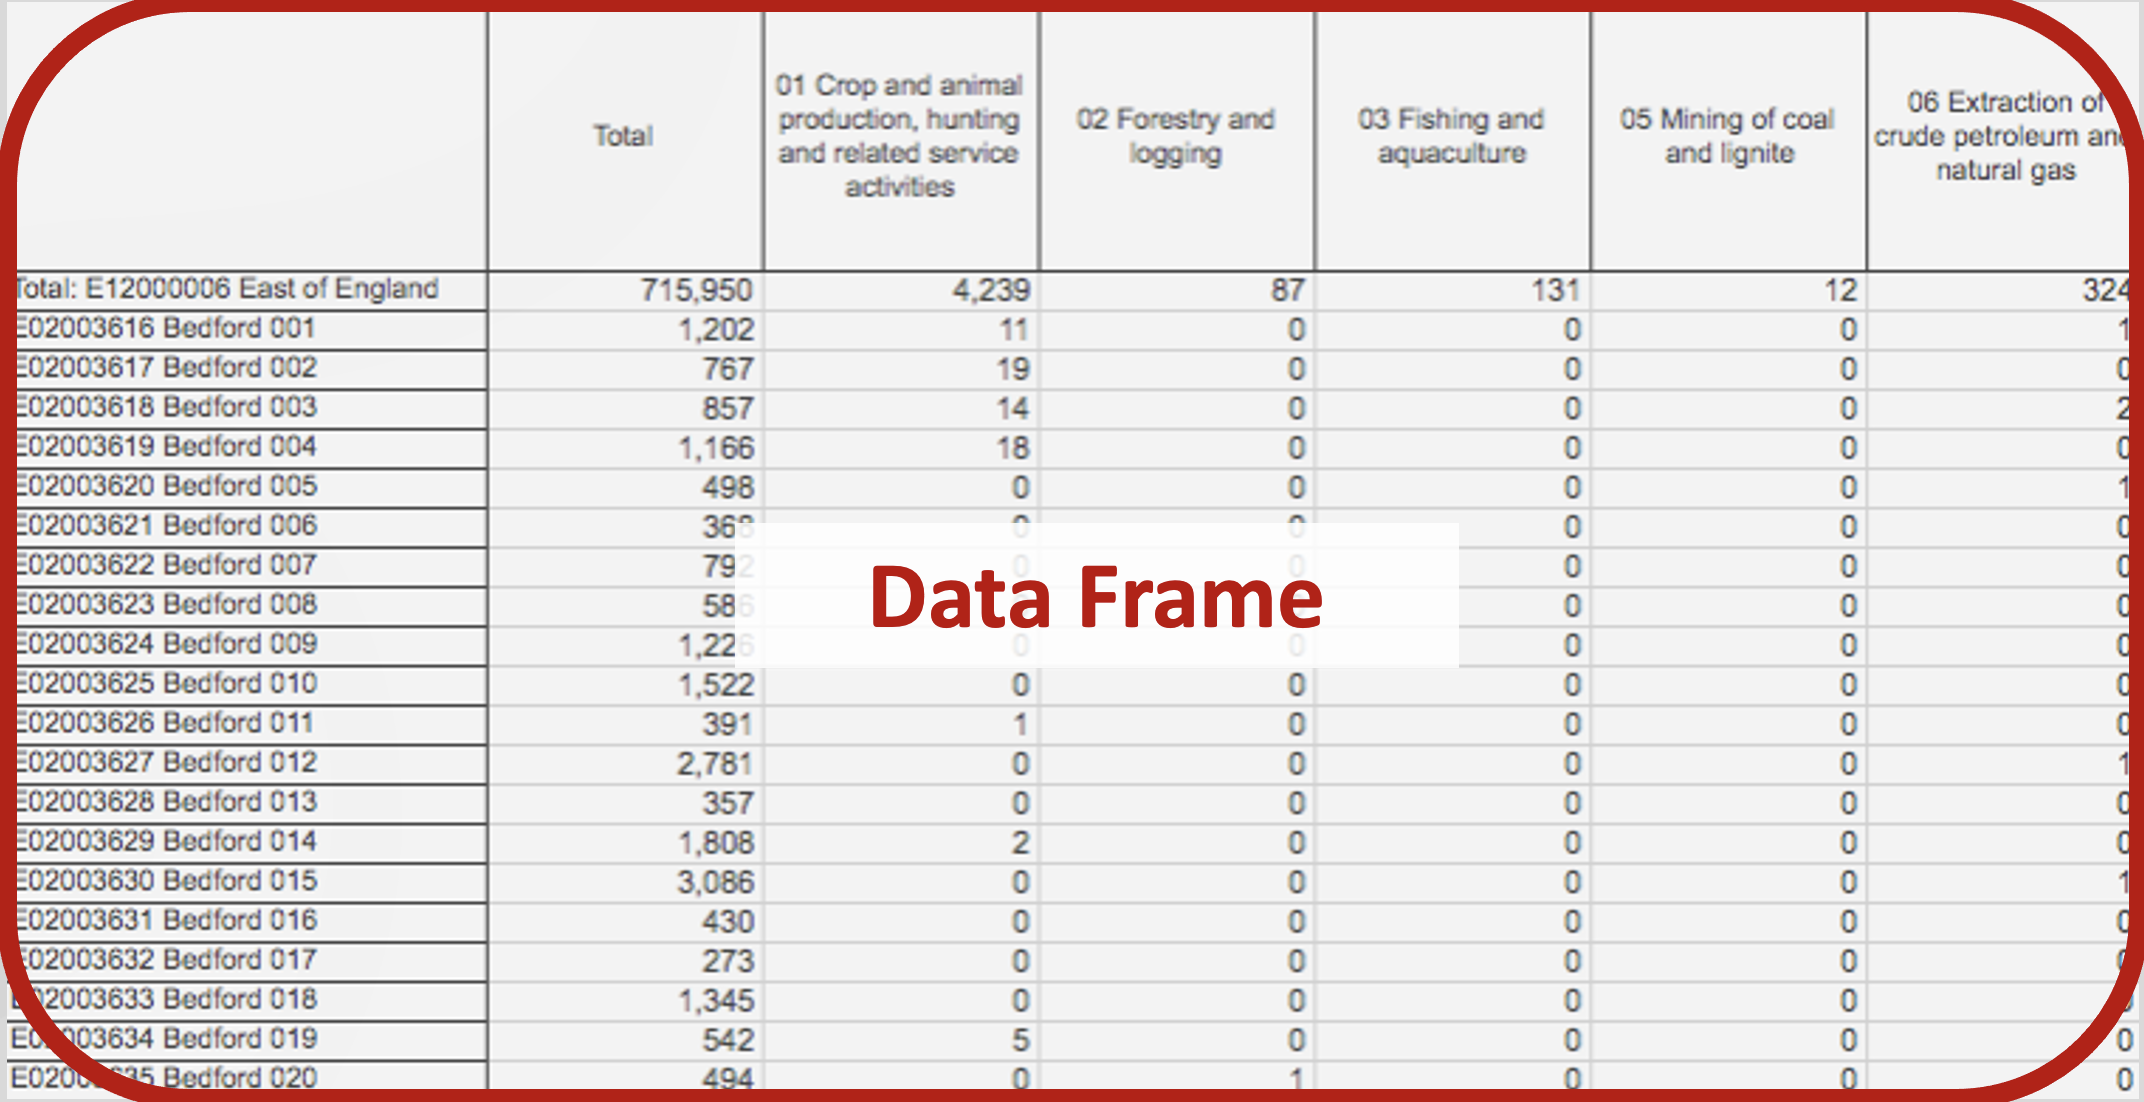
Data Frames vs Series
Pandas operates on two principles:
Any operation on a Data Frame returns a Data Frame.
Any operation on a Series returns a Series.
‘Shallow’ Copies
More subtly, operations on a Series or Data Frame return a shallow copy, which is like a ‘view’ in a database…
The original is unchanged unless you specify inplace=True (where supported).
Attempts to change a subset of the data frame will often trigger a SettingWithCopyWarning warning.
If you need a full copy then use the copy() method (e.g. df.copy() or df.Series.copy()).
Putting These Ideas Together
# Returns a series but not a columndf.Latitude -1# Saves returned series as a new columndf['lat'] = df.Latitude -1# Returns a new data frame w/o 'lat' df.drop(columns=['lat']) # Modifies df directlydf.drop(columns=['lat'], inplace=True) # Try to modify a view of df (triggers warning)df[df['Primary Type']=='BURGLARY'].Latitude =41.7
What Can We Do?
Chaining
Operations on a Data Frame return a DataFrame and operations on a Series return a Series, allowing us to ‘chain’ steps together:
Latitude     41.849874
Longitude   -87.655523
dtype: float64
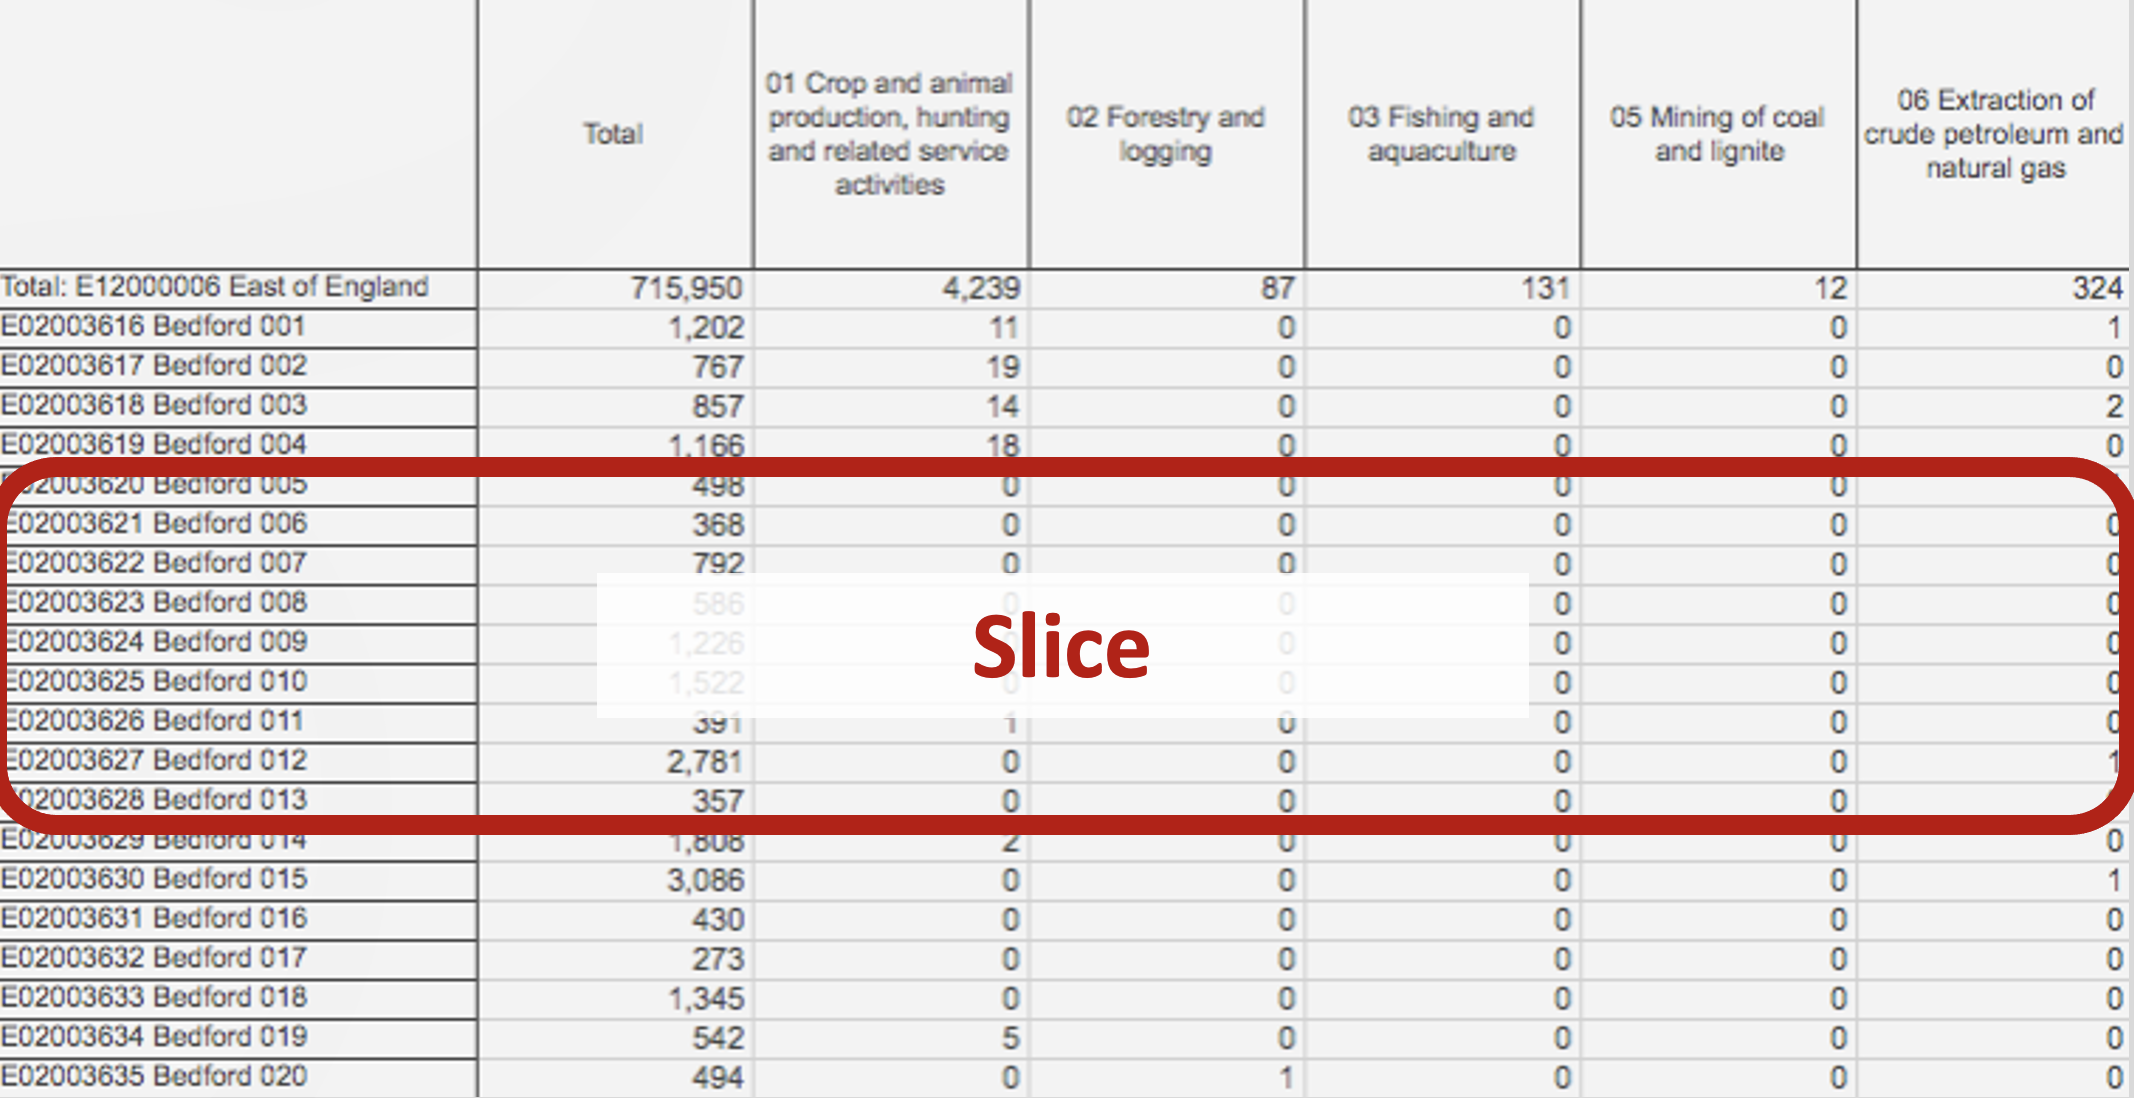
Selection
# Returns a selection (Boolean series)df['Primary Type']=='ASSAULT'# All rows where Primary Type is ASSAULTdf[ df['Primary Type']=='ASSAULT' ]# Calculations on a slice (returns mean centroid!)df[df['Primary Type']=='ASSAULT'][['Longitude','Latitude']].mean()# Two conditions with a bit-wise ANDdf[ (df['Primary Type']=='ASSAULT') & (df['Description']=='AGGRAVATED: HANDGUN')]# Two conditions with a bit-wise ORdf[ (df['Primary Type']=='ASSAULT') | (df['Primary Type']=='THEFT')]
Now we can automate… data anlysis!
Dealing with Types
A Data Series can only be of one type:
Pandas Dtype
Python Type
Usage
object
str or mixed
Text or mixed columns (including arrays)
int64
int
Integer columns
float64
float
Floating point columns
bool
bool
True/False columns
datetime64
N/A (datetime)
Date and time columns
timedelta[ns]
N/A (datetime)
Datetime difference columns
category
N/A (set)
Categorical columns
Changing the Type
print(df['Primary Type'].unique()) # Find unique valuesprint(df['Primary Type'].dtype.name) # Confirm is 'object'df['Primary Type'] = df['Primary Type'].astype('category')print(df['Primary Type'].dtype.name) # Confirm is 'category'print(df['Primary Type'].describe()) # Category column info
pd.to_datetime(...) is not a method, it’s a function from the pandas package.
df.Date.array (and df.Date.to_numpy() and df.Data.tolist()) gives access to the data directly, whereas df.Date gives access to the Series.
Deprecation Warning!
From time to time, real-world software projects will change the way things work. Pandas is just such a project!
Warning
We recommend using Series.array or Series.to_numpy(), depending on whether you need a reference to the underlying data or a NumPy array. See API Documenation.
So while Series.values still works, and will continue to work for some time, you are being advised to start using Series.array or Series.to_numpy() instead. Meaning, we should consider using df.Date.array.
Tidying Up
This is one way, there are many options and subtleties…
# Fix categoriesmapping = {}# df['Primary Type'].unique().to_list() also worksfor x in df['Primary Type'].cat.categories.to_list(): mapping[x]=x.title()# And updatedf['Primary Type'] = df['Primary Type'].cat.rename_categories(mapping)
How would you work out what this code does? 1
To deal with pricing information treated as a string:
df2['price'].str.replace('$','').astype(float)
Many more examples accessible via Google!
Dropping Rows and Columns
There are multiple ways to drop ‘stuff’:
df2 = df.copy()print(f"The data frame has {df2.shape[0]:,} rows and {df.shape[1]:,} cols.")df2.drop(index=range(5,10), inplace=True) # Row 'numbers' or index valuesprint(f"The data frame has {df2.shape[0]:,} rows and {df.shape[1]:,} cols.")df.drop(columns=['Year'], inplace=True) # Column name(s)print(f"The data frame has {df2.shape[0]:,} rows and {df.shape[1]:,} cols.")
There is also df.dropna() which can apply to rows or columns with NULL or np.nan values.
I often prefer df = df[df.index > 15] (negative selection) to df.drop(index=range(0,14)) (positive selection).
Accessing Data by Location
Index
0
1
2
3
ID
Case Number
Date
Primary Type
0
11667185
JC237601
04/20/2020 11:00:00PM
BURGLARY
1
11998178
JC532226
12/02/2020 10:35:00AM
DECEPTIVE PRACTICE
2
11852571
JC462365
10/06/2020 04:50:00PM
BATTERY
We can interact with rows and columns by position or name:
df.iloc[0:2,0:2] # List selection! (':' means 'all')df.loc[0:2,['ID','Case Number']] # Dict selection
These actually return different results because of the index:
df.loc returns the rows labeled 0, 1, and 2 ([0..2]), whereas
df.iloc returns the range 0..2 ([0..2))!
Indexes
So by default, pandas creates a row index index whose values are 0..n and column index whose values are the column names. You will see this if you print out the head:
df.head(3)
The left-most column (without) a name is the index.
df.set_index('ID', inplace=True)df.head(3)
Now we see:
         Case Number                    Date  ...  Longitude                  dt
ID                                            ...
11667185    JC237601  04/20/2019 11:00:00 PM  ... -87.603468 2019-04-20 11:00:00
11909178    JC532226  12/02/2019 10:35:00 AM  ... -87.643230 2019-12-02 10:35:00
11852571    JC462365  10/06/2019 04:50:00 PM  ... -87.758473 2019-10-06 04:50:00
So ID is now the index and is not accessible as a column: df.ID will now throw an error because it’s not longer part of the Column Index.
CSV file. But note the options to change sep (default is ',') and to suppress index output (index=False).
df.to_excel(<path>)
XLSX file. But note the options to specify a sheet_name, na_rep, and so on, as well as to suppress the index (index=False).
df.to_feather(<path>)
Directly usable by R. Requires pyarrow to be installed to access the options.
df.to_parquet(<path>)
Directly usable by many languages. Requires pyarrow to be installed to access the options.
df.to_latex(<path>))
Write a LaTeX-formatted table to a file. Display requires booktabs. Could do copy+paste with print(df.to_latex()).
df.to_markdown(<path>)
Write a Markdown-formatted table to a file. Requires tabulate. Could do copy+paste with print(df.to_markdown()).
In most cases compression is detected automatically (e.g. df.to_csv('file.csv.gz')) but you can also specify it (e.g. df.to_csv('file.csv.gz', compression='gzip')).1